
- United Kingdom: retail sales fall 1.6% in August.
- The pound collapses on all fronts after the figures.
- EUR/GBP at a year-and-a-half high, GBP/USD at a 1985 low.
After closing near the highs and for the first time in years above 0.8700 on Thursday, the EUR/GBP received a boost on Friday with the weakness of the pound giving it the strength to break above 0.8730 and reach 0.8772, the lowest level. high from February 2021.
The pound was hit on Friday by poor UK retail sales data, which fell 1.6% in August, worse than the expected 0.5% decline. The report detailed that all sectors registered contractions in numbers, something that had not happened since July 2021.
Added to the weakness of the British currency were technical factors and the drop in the GBP/USD, which hit a low since 1985 in the area of 1.1349, on the day that marks the 30th anniversary of “Black Wednesday”. On that day the pound had a sharp devaluation that forced it to leave the European Exchange Rate Mechanism after not being able to hold on to the lower limit.
From the new maximum cycle, EUR/GBP pulled back slightly and is trading around 0.8750, on the way to the first weekly close above the 200-week average since January 2021. It is also beginning to confirm above 0.8700, a long-term technical level. This suggests more gains in the medium term for the cross.
For the next few days, what happens with the crossing may be in the hands of the Bank of England qthat next week will decide on monetary policy. A 50 basis point rise in the interest rate is expected.
EUR/GBP weekly chart
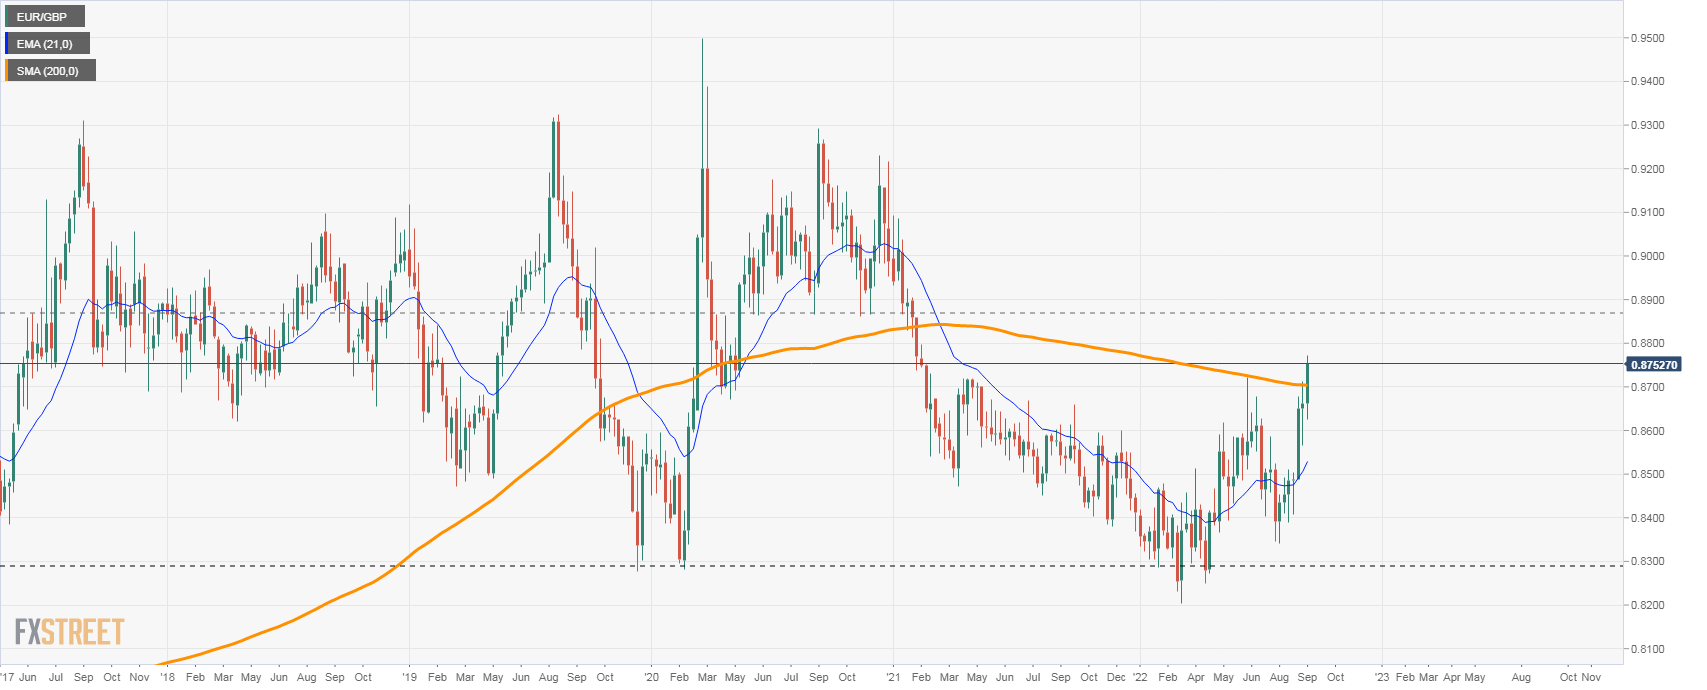
Source: Fx Street
With 6 years of experience, I bring to the table captivating and informative writing in the world news category. My expertise covers a range of industries, including tourism, technology, forex and stocks. From brief social media posts to in-depth articles, I am dedicated to creating compelling content for various platforms.


