
- The EUR/GBP pair is trading at 0.8560, with a gain of 0.25%, in the American session on Thursday.
- The president of the ECB, Lagarde, was at the microphones but did not offer any information.
- The British pound is weak due to weaker-than-expected fourth quarter GDP data.
In Thursday's session, the EUR/GBP pair traded at 0.8560, a gain of 0.25%, as the Pound weakened due to weaker-than-expected Q4 GDP data. However, the Bank of England (BoE) is expected to remain firm and divergent monetary policies with the European Central Bank (ECB) will ultimately benefit the Pound.
Along these lines, while markets expect the first rate cut in June by the ECB, economists foresee 125 bp of total easing within the next year, a decrease from the 150 bp forecast in February and in case investors start to see less easing, the pair could continue to rise.
Meanwhile, the UK recorded its first consecutive quarter of contraction since the start of 2020, with a quarter-on-quarter decline of 0.3% in the fourth quarter, beating the forecast of 0.1%. However, despite the weak data, markets expect the BOE will not rush to cut rates, and for now, the consensus is that full easing will be between 75bp and 100bp in 2024. As long as it persists the divergence between the BoE and the ECB, the pound's losses are limited.
EUR/GBP technical analysis
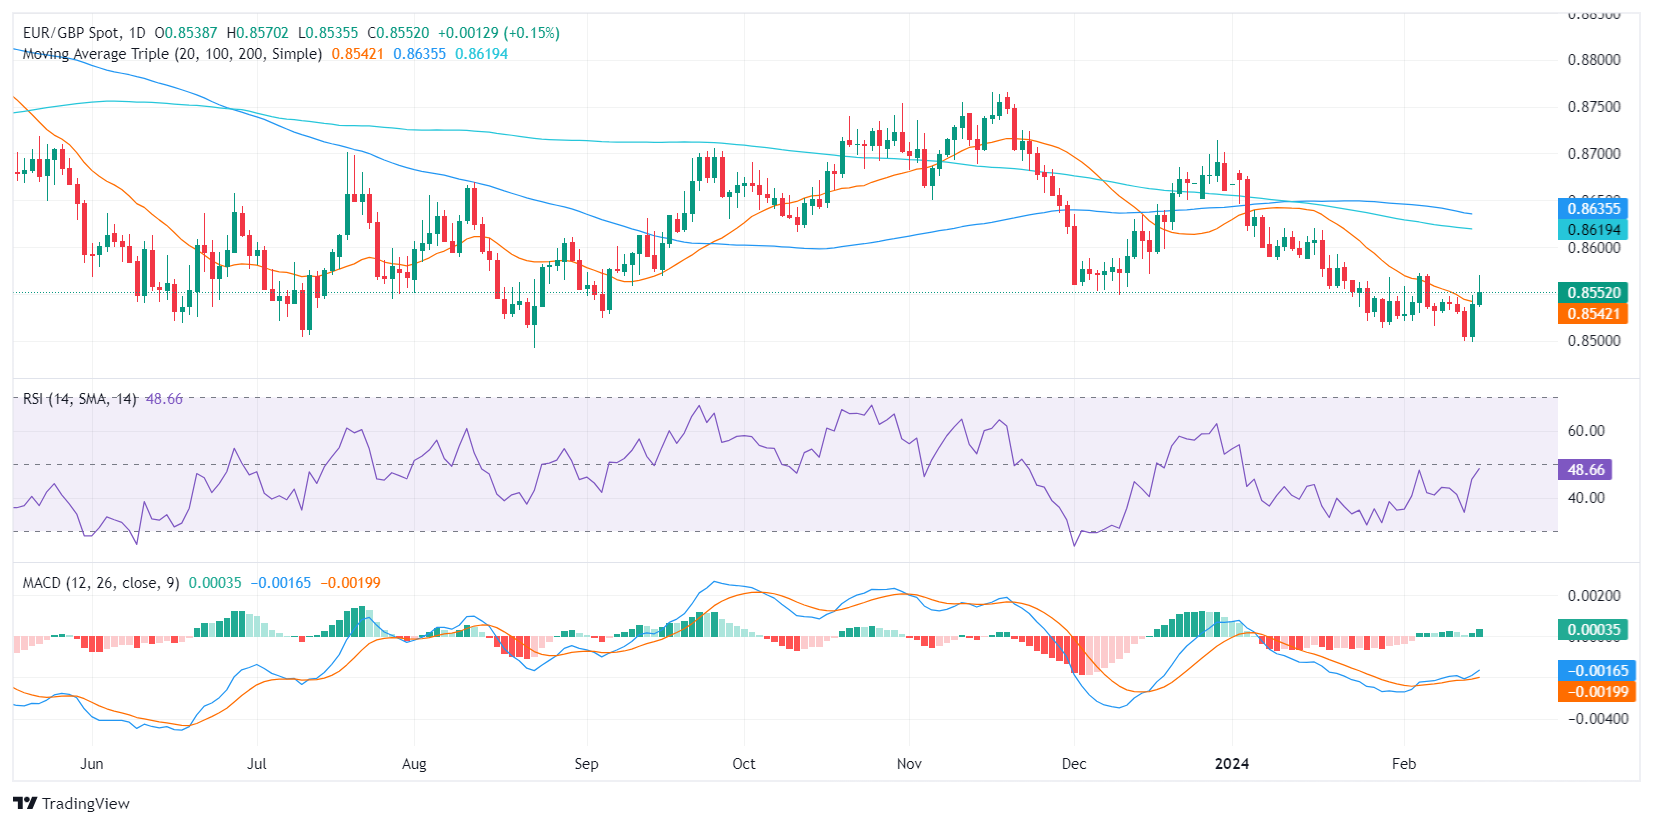
On the daily chart, the Relative Strength Index (RSI) for the EUR/GBP pair is close to jumping into positive territory, indicating that buyers are gaining ground. Furthermore, the moving average convergence divergence (MACD) histogram has been consistently positive, indicating that positive momentum is strong.
However, it is important to note that the broader outlook, represented by the simple moving averages (SMA), continues to favor sellers as the pair is trading below the 100-day and 200-day SMA. That said, the bulls managed to jump above the 20-day moving average, so in the short term, the outlook could start to look positive for them.
EUR/GBP daily chart
Source: Fx Street
I am Joshua Winder, a senior-level journalist and editor at World Stock Market. I specialize in covering news related to the stock market and economic trends. With more than 8 years of experience in this field, I have become an expert in financial reporting.


