
- Core and headline inflation figures for February were softer than expected.
- Monetary policy divergences between the BoE and the ECB continue to favor sterling.
- The BoE meets on Thursday, maintenance and the first cut are expected in August.
- The ECB's first cut came in June.
The EUR/GBP pair is registering slight gains and is trading at 0.8541 after reaching a high of 0.8560. Markets are digesting UK inflation data for February and preparing for the Bank of England (BoE) decision on Thursday. Meanwhile, monetary policy divergences between the BoE and the European Central Bank (ECB) give the pound an advantage against the Euro.
In the United Kingdom, February CPI figures softened: headline inflation stood at 3.4% annually, down from 4.0% in January, and core inflation at 4.5% annually, down from 5.1%. Despite expectations, these figures were slightly lower, marking the lowest level since September 2021, but still above the 2% target. Given the imminent decision of the Bank of England, maintenance of monetary policy is expected. However, given persistently high services inflation (6.1% annually), the BoE could take time to ease its policy. Markets are expecting a 25 basis point rate cut in August, followed by two more by the end of the year. On the other hand, the ECB's easing cycle is considered to begin in June, followed by cuts in September and October. Investors also see chances of a further cut in December.
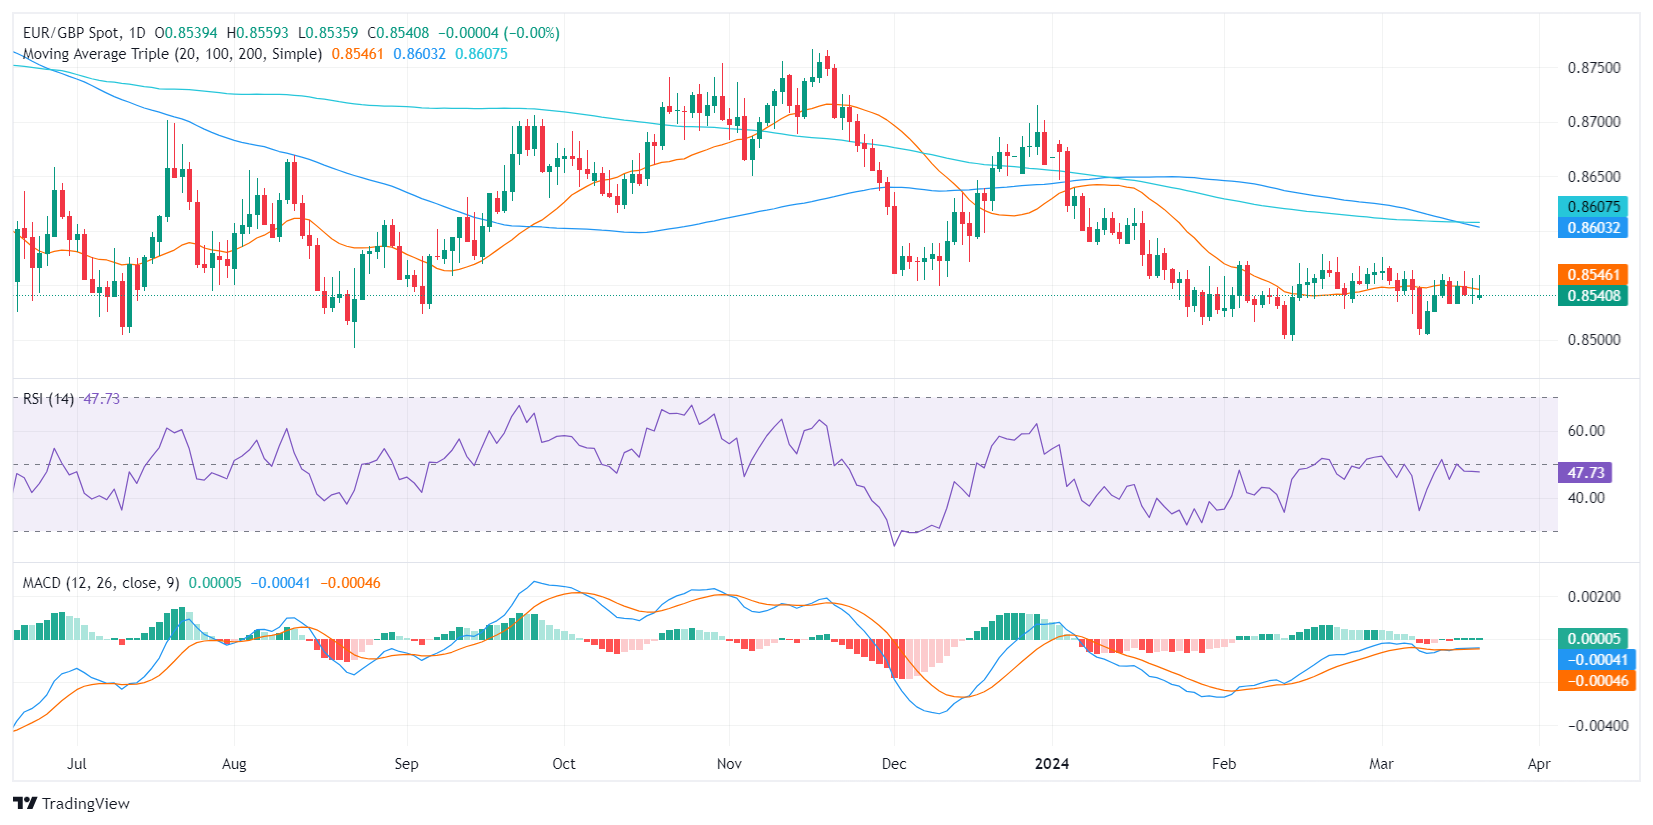
EUR/GBP technical analysis
On the daily chart, the Relative Strength Index (RSI) for the EUR/GBP pair is in negative territory, suggesting slight bearish momentum. Despite brief transitions into positive territory, the RSI has returned to negative levels in recent sessions, revealing that sellers maintain dominance. The green bars of the moving average convergence divergence (MACD) histogram reflect positive, albeit flat, momentum, which could indicate a weak bull presence.
Regarding the general trend, the pair is trading below its 20, 100 and 200 hourly simple moving averages, which gives arguments in favor of a bearish outlook.
EUR/GBP daily chart
Source: Fx Street
I am Joshua Winder, a senior-level journalist and editor at World Stock Market. I specialize in covering news related to the stock market and economic trends. With more than 8 years of experience in this field, I have become an expert in financial reporting.


