
- The EUR/JPY pair continues to rise and reaches 15-year highs.
- The Yen tentatively advances during the day on Wednesday.
- Investors are likely to start seeing signs of intervention from the BOJ.
The EUR/JPY pair is approaching its highest bids in over 15 years, trading north of 161.50 and looking for higher. The Japanese Yen (JPY) has suffered recently, virtually abandoned by a hyper-dovish Bank of Japan that remains fully focused on shoring up long-term growth expectations for the Japanese economy, even as the Yen continues to fall to record lows.
The Bank of Japan remains firmly stuck to its hyper-loose monetary policy, so the Yen has no choice but to sink on the charts, and the Euro (EUR) is experiencing a bullish breakout.
With the yen trading so poorly against other assets, it is only a matter of time before someone at the Bank of Japan decides enough is enough and begins intervening in currency markets in an attempt to protect its national currency from further sales.
Japan’s trade balance figures will be released early in Asian markets on Thursday, with September’s seasonally adjusted current account expected to rise from 2.2 trillion to 3 trillion Japanese yen.
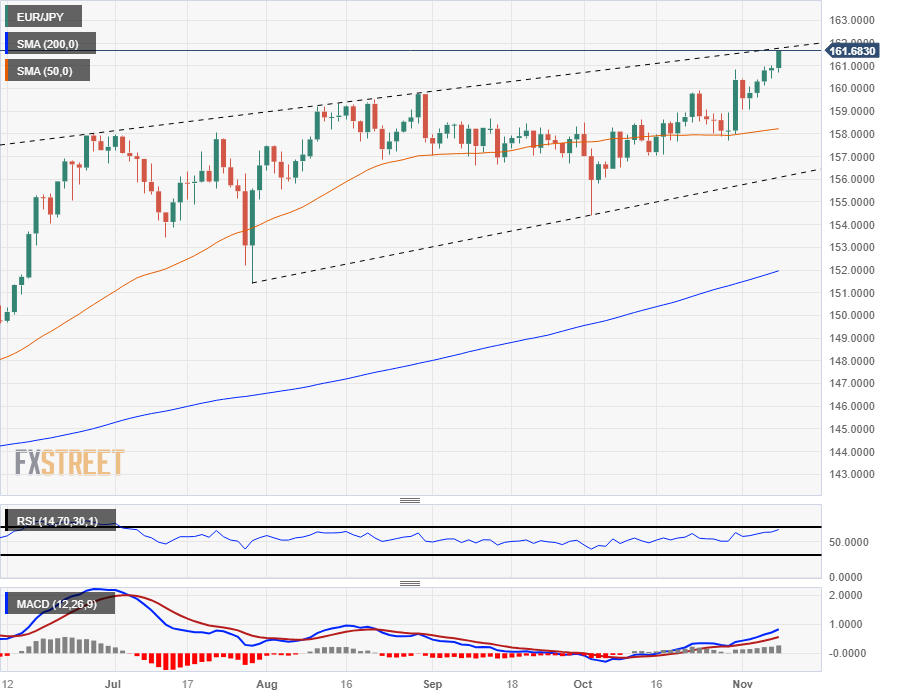
EUR/JPY Technical Outlook
The Euro is up over 2.5% against the Yen from last week’s low at 157.70, and with few technical patterns on the upside to limit bullish momentum, the pair could see an easy break into record territory.
Last week, the EUR/JPY pair bounced off the 50-day SMA, and long-term chart support lies in the 152.00 area with the 200-day SMA.
An uptrend line from the late July low at 152.00 also marks a technical bottom in the 156.00 area.
EUR/JPY Daily Chart
EUR/JPY technical levels
Source: Fx Street
I am Joshua Winder, a senior-level journalist and editor at World Stock Market. I specialize in covering news related to the stock market and economic trends. With more than 8 years of experience in this field, I have become an expert in financial reporting.


