
- The EUR/JPY pair is trading at its highest bids since 2008, near the 164.00 level.
- A rebound in the general market sentiment causes safe haven values to fall sharply this Tuesday.
- Next: Japan’s GDP early in the session on Wednesday.
The EUR/JPY pair has hit its highest prices since 2008, a fifteen-year high for the pair, as the safe-haven Japanese Yen (JPY) declines against the Euro (EUR). A broad recovery in risk appetite in markets, fueled by the release of a worse-than-expected US Consumer Price Index (CPI), is giving investors renewed hope that inflation could be receding faster than expected. expected by the Federal Reserve (Fed), which means that the US central bank could be pushed to cut rates sooner than expected.
Early on Tuesday, the EU’s Gross Domestic Product (GDP) was exactly at the expected level, with a quarter-on-quarter rate of -0.1%. The annualized figure remained at 0.1%.
The ZEW survey on economic sentiment for November improved noticeably, standing at 13.8 points compared to 2.3 in October.
Japanese GDP figures will be released early in the session on Wednesday, with the quarter-on-quarter figure expected to decline from 1.2% to a contraction of -0.1%.
Current rate of the Japanese Yen
Below is the percentage change of the Japanese Yen (JPY) against the currencies listed today. The Japanese currency was the weakest against the New Zealand dollar.
| USD | EUR | GBP | CAD | AUD | JPY | NZD | CHF | |
| USD | -1.57% | -1.68% | -0.68% | -1.86% | -0.74% | -1.96% | -1.32% | |
| EUR | 1.55% | -0.11% | 0.88% | -0.28% | 0.82% | -0.38% | 0.25% | |
| GBP | 1.65% | 0.10% | 0.98% | -0.18% | 0.92% | -0.29% | 0.36% | |
| CAD | 0.66% | -0.90% | -1.01% | -1.18% | -0.09% | -1.29% | -0.63% | |
| AUD | 1.83% | 0.27% | 0.17% | 1.16% | 1.09% | -0.11% | 0.53% | |
| JPY | 0.74% | -0.82% | -0.92% | 0.07% | -1.11% | -1.19% | -0.57% | |
| NZD | 1.93% | 0.38% | 0.28% | 1.29% | 0.12% | 1.18% | 0.62% | |
| CHF | 1.30% | -0.25% | -0.36% | 0.65% | -0.52% | 0.57% | -0.64% |
The map shows the percentage changes of the major currencies against each other. The base currency is chosen in the left column, while the quote currency is chosen in the top row. For example, if you choose the euro in the left column and scroll down the horizontal line to the Japanese yen, the percentage change in the box will represent EUR (base)/JPY (quote).
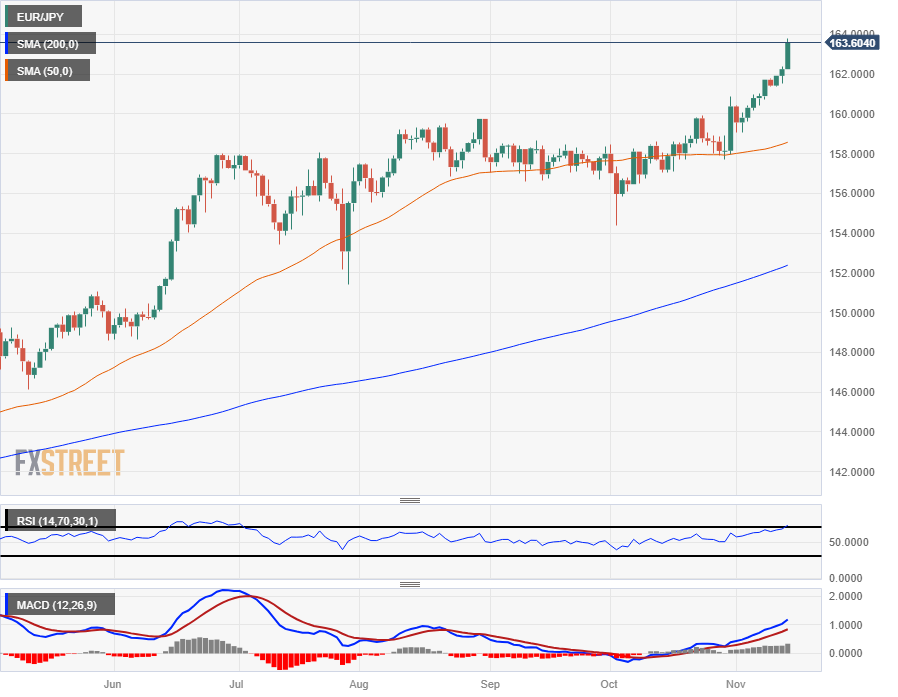
EUR/JPY Technical Outlook
The Euro has extended its rally against the Yen, closing in the green for nine of the last eleven consecutive trading days. The EUR/JPY pair is preparing to challenge the 164.00 area.
The euro’s latest bullish run has led the pair to move away from the bullish 50-day Moving Average (SMA) which currently sits in the 158.00 area, while long-term support lies at the 200-day SMA near 152.00, well below the current price action.
EUR/JPY Daily Chart
 EUR/JPY technical level
Source: Fx Street
I am Joshua Winder, a senior-level journalist and editor at World Stock Market. I specialize in covering news related to the stock market and economic trends. With more than 8 years of experience in this field, I have become an expert in financial reporting.


