
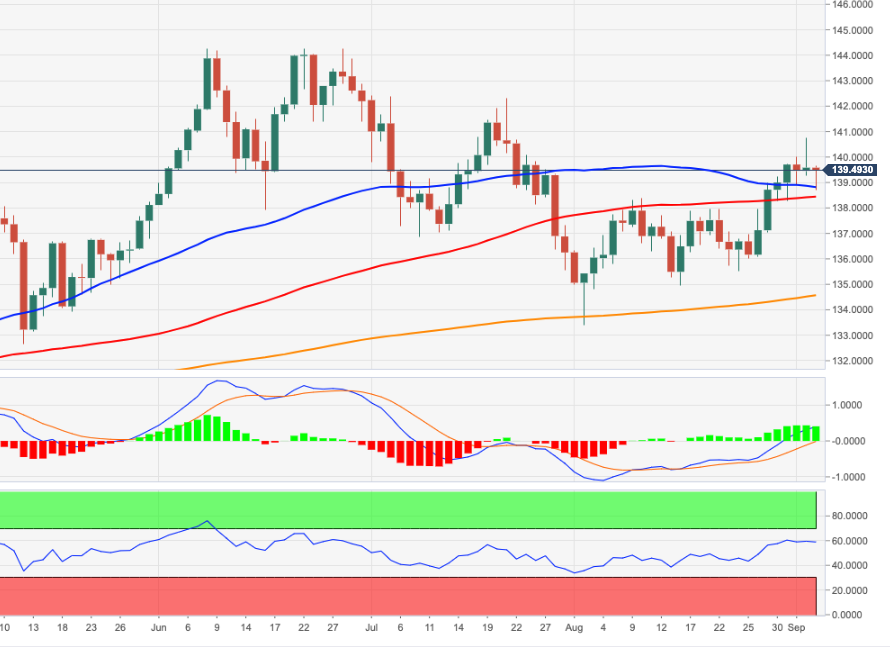
- EUR/JPY adds to Friday’s small gains below 140.00.
- The next hurdle to watch is at the 142.30 area.
The EUR/JPY alternate gains with losses around 139.00 after bottoming out at early lows near 138.70 on Monday.
Further gains in the cross are now favored once it breaks past the recent high of 140.74 (Sept 2). Beyond this level, another visit to the weekly high at 142.32 (July 21) should reappear on the horizon before the 2022 high at 144.27 (June 28).
As long as it is above the 200-day SMA at 134.54, the outlook for the pair should remain constructive.
EUR/JPY daily chart
Technical levels
Source: Fx Street
With 6 years of experience, I bring to the table captivating and informative writing in the world news category. My expertise covers a range of industries, including tourism, technology, forex and stocks. From brief social media posts to in-depth articles, I am dedicated to creating compelling content for various platforms.


