
- EUR/JPY partially erases the positive start to the week on Tuesday.
- It seems likely that the range will continue in the near term horizon.
EUR/JPY maintains the sideways phase for yet another session on Tuesday.
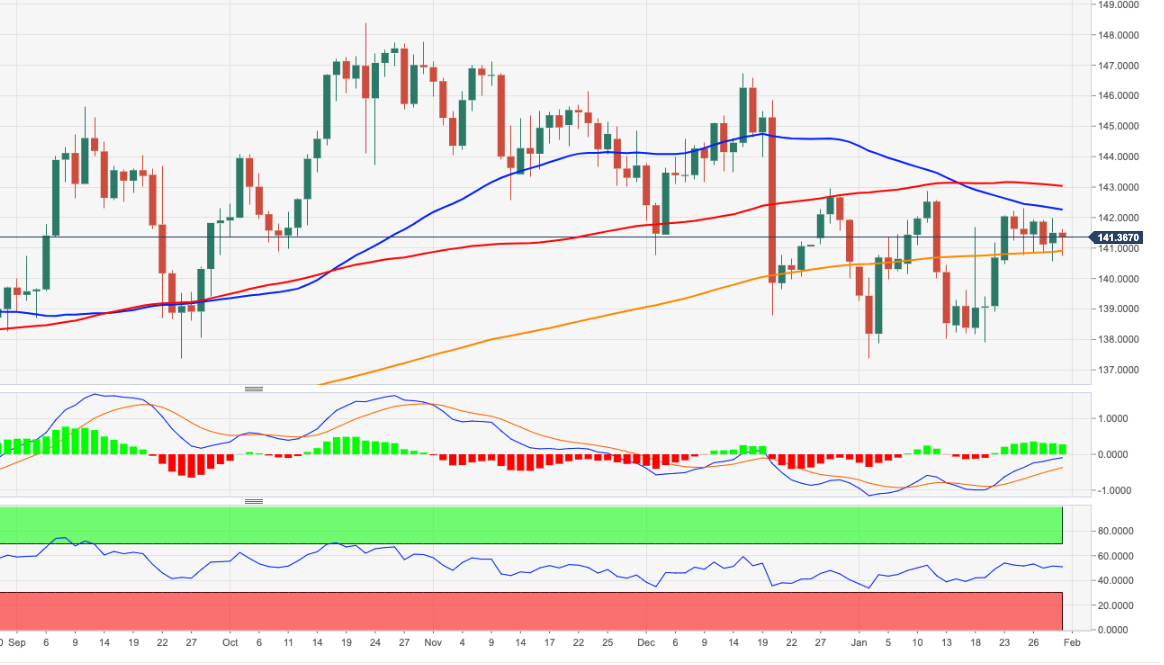
Further consolidation in the near term should not be ruled out. Should the decline accelerate, the next support to watch is the 200-day SMA at 140.87 today. A sustainable drop below this SMA would expose the cross to lower down to initially 138.00. To the upside, a break of the weekly high at 142.29 (Jan 25) could open the door for a possible test of the key resistance zone around 143.00.
The constructive outlook for the EUR/JPY looks unchanged to remain above the 200-day SMA.
EUR/JPY day chart
Source: Fx Street
I am Joshua Winder, a senior-level journalist and editor at World Stock Market. I specialize in covering news related to the stock market and economic trends. With more than 8 years of experience in this field, I have become an expert in financial reporting.


