
- EUR/JPY adds to the downward correction and breaks 144.00.
- The continuation of the lower leg could revisit 142.50.
EUR/JPY corrects lower and briefly tests the 143.60 area on Thursday, or multi-session lows.
The cross reversed the strong bounce shortly after breaching the 146.00 area on Wednesday and triggered quite a sharp reversal. That being said, further weakness could cause EUR/JPY to drop back to the November low at 142.54 (11 Nov) sooner rather than later.
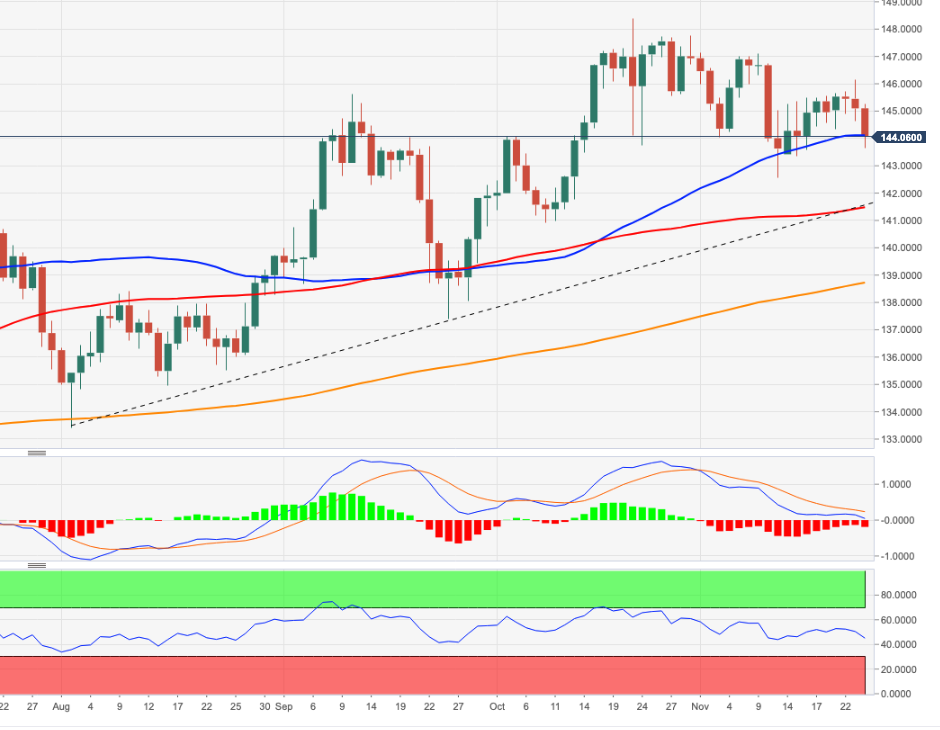
Longer-term, as long as it is above the key 200-day SMA at 138.68, the positive outlook is expected to hold.
EUR/JPY day chart
Source: Fx Street
I am Joshua Winder, a senior-level journalist and editor at World Stock Market. I specialize in covering news related to the stock market and economic trends. With more than 8 years of experience in this field, I have become an expert in financial reporting.


