
- EUR/JPY reverses after back-to-back daily declines and approaches 143.00.
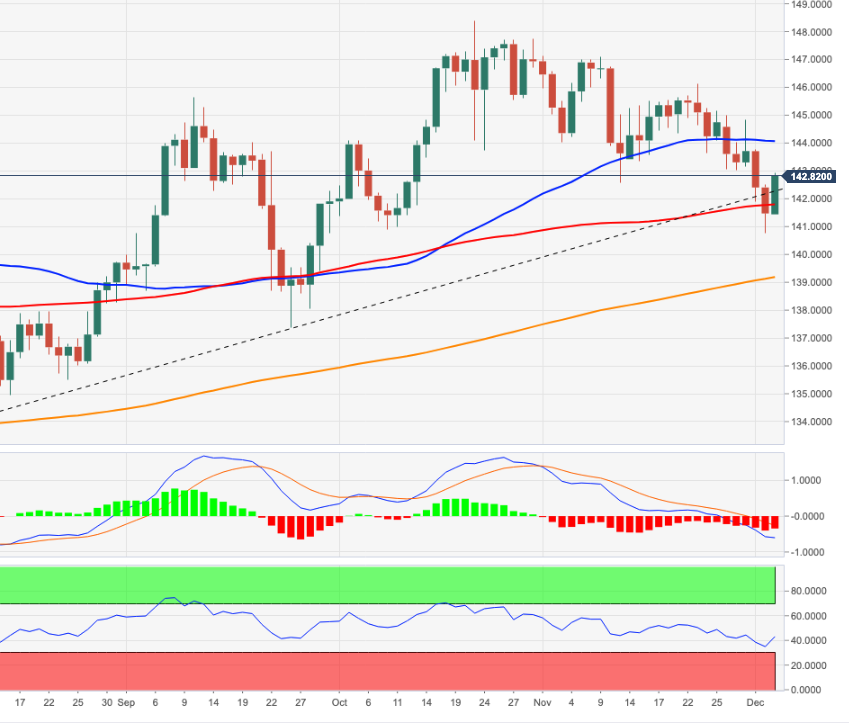
- A deeper pullback could test the key 200-day SMA at 139.15.
EUR/JPY bounces from 3-month lows on Friday and manages to flirt with the round 143.00 level at the start of the week.
Despite the ongoing bounce, the cross remains under pressure and could still give up more ground and revisit the critical 200-day SMA on the near-term horizon.
The outlook for the EUR/JPY is expected to remain positive as long as it is above this latest SMA.
EUR/JPY day chart
Source: Fx Street
I am Joshua Winder, a senior-level journalist and editor at World Stock Market. I specialize in covering news related to the stock market and economic trends. With more than 8 years of experience in this field, I have become an expert in financial reporting.


