
- EUR/JPY continues to lose ground and breaks the 142.00 level.
- The next support is at the 200-day moving average, near 140.80.
EUR/JPY extends the weekly decline and on Wednesday breaks below the key support of 142.00, anchoring two-day lows.
Should the decline accelerate, the next support to watch is the 200-day SMA at 140.79 today. A sustainable drop below this last level would expose the cross to further weakness to initially the 138.00 area.
The constructive outlook for the EUR/JPY looks unchanged to remain above the 200-day SMA for now.
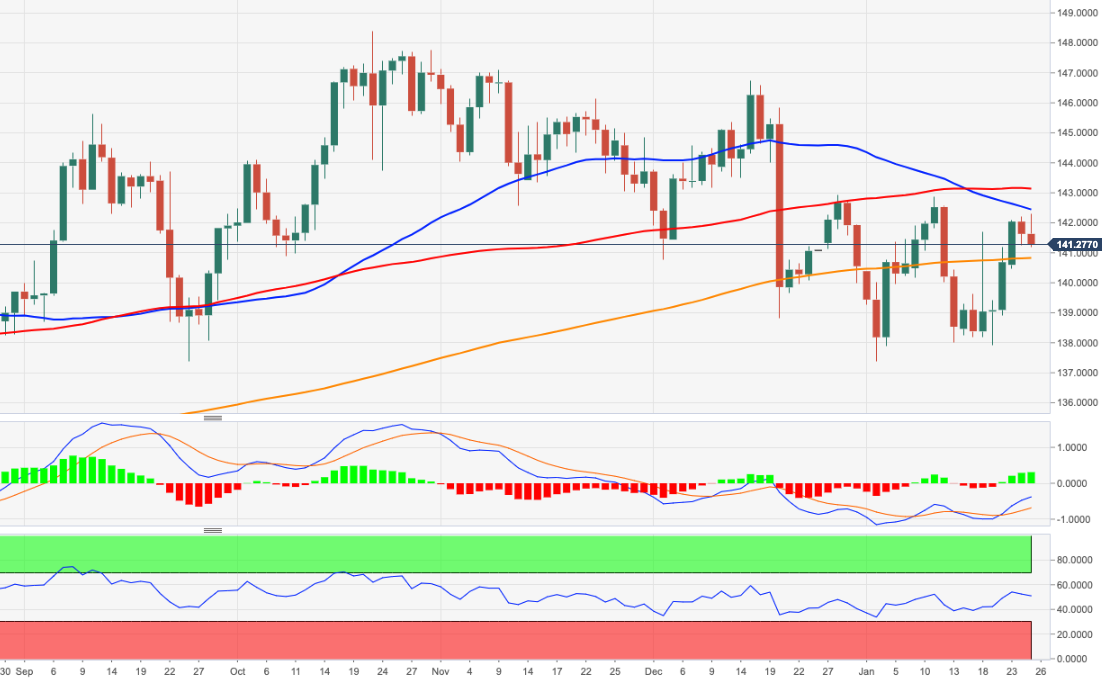
EUR/JPY day chart
Source: Fx Street
I am Joshua Winder, a senior-level journalist and editor at World Stock Market. I specialize in covering news related to the stock market and economic trends. With more than 8 years of experience in this field, I have become an expert in financial reporting.


