
- EUR/JPY briefly revisits the 138.00 area on Tuesday.
- Two-month support line near 134.85 holds downsides limited.
EUR/JPY briefly flirted with the 138.00 environment only to lose some traction shortly after on Tuesday.
The continuation of the bullish bias faces the next hurdle at the May high at 138.31 (May 9). Breaking above this level should open the door for a move towards 2022 highs around 140.00 (Apr 21).
In the meantime, if it remains above the two-month support line around 134.85, the short-term outlook for the cross should remain bullish.
EUR/JPY day chart
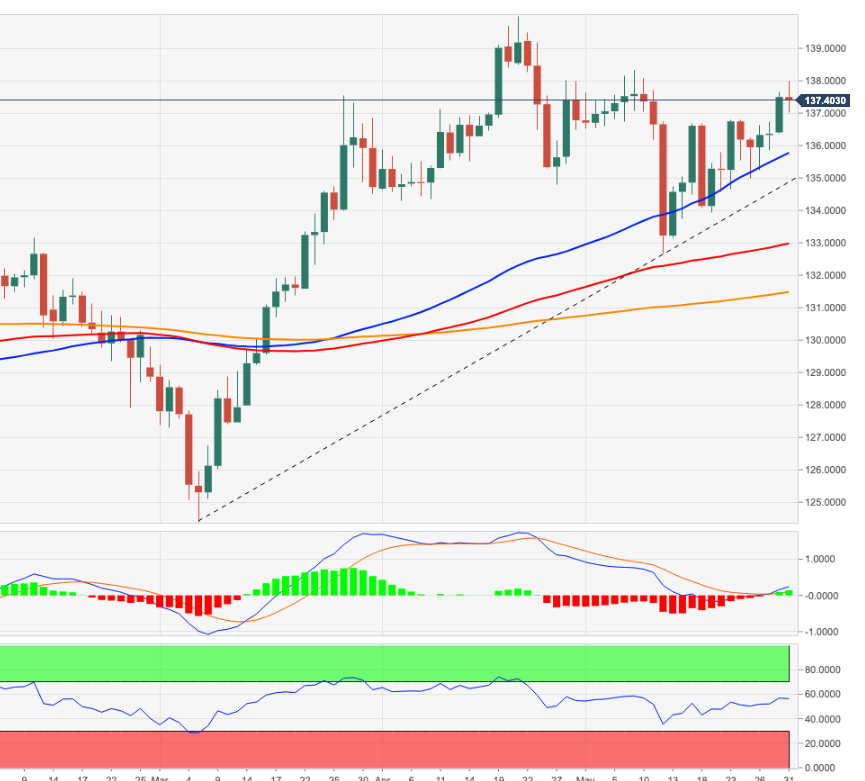
Source: Fx Street
With 6 years of experience, I bring to the table captivating and informative writing in the world news category. My expertise covers a range of industries, including tourism, technology, forex and stocks. From brief social media posts to in-depth articles, I am dedicated to creating compelling content for various platforms.


