
- The EUR/JPY recovers the bullish path after the marked fall on Tuesday.
- Breaking above 150.00 could trigger further gains in the short term.
He USD/JPY trades with decent gains above the 149.00 zone on Wednesday.
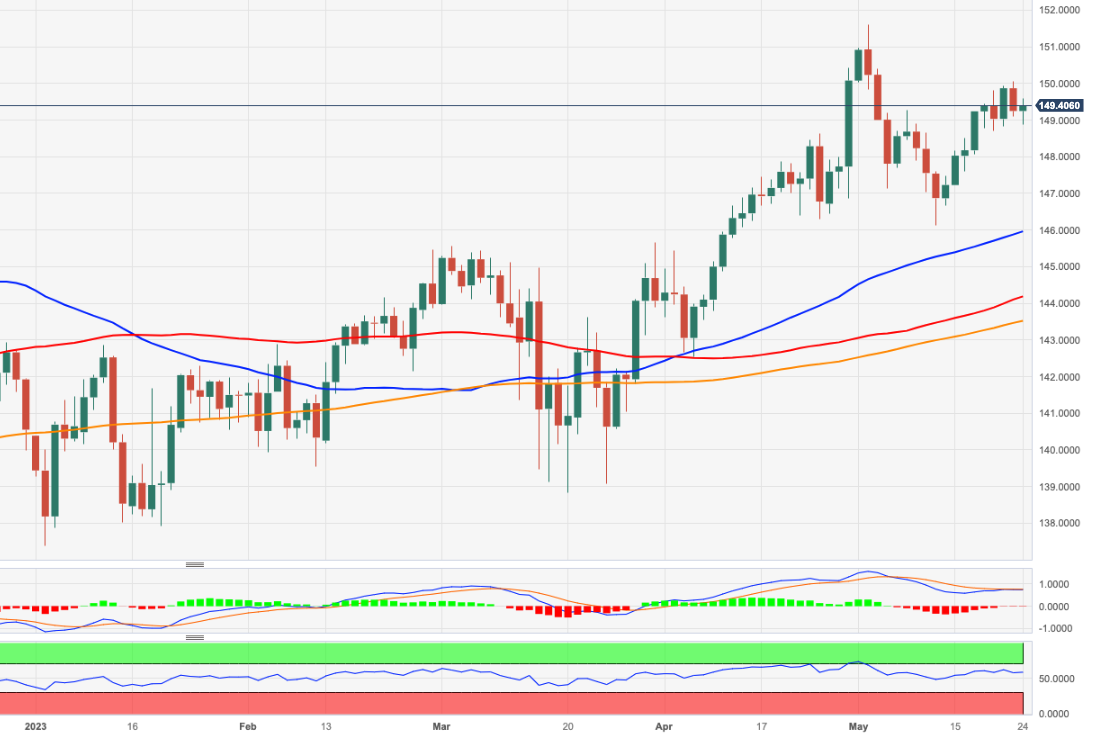
Although the cross appears to have embarked on a consolidation phase, a convincing break of the key round level of 150.00 could encourage the cross to challenge the 2023 high at 151.61 (May 2) on the near-term horizon.
For now, rallies are favored as long as the cross trades above the 200-day SMA at 143.49 today.
EUR/JPY daily chart
Source: Fx Street
I am Joshua Winder, a senior-level journalist and editor at World Stock Market. I specialize in covering news related to the stock market and economic trends. With more than 8 years of experience in this field, I have become an expert in financial reporting.


