
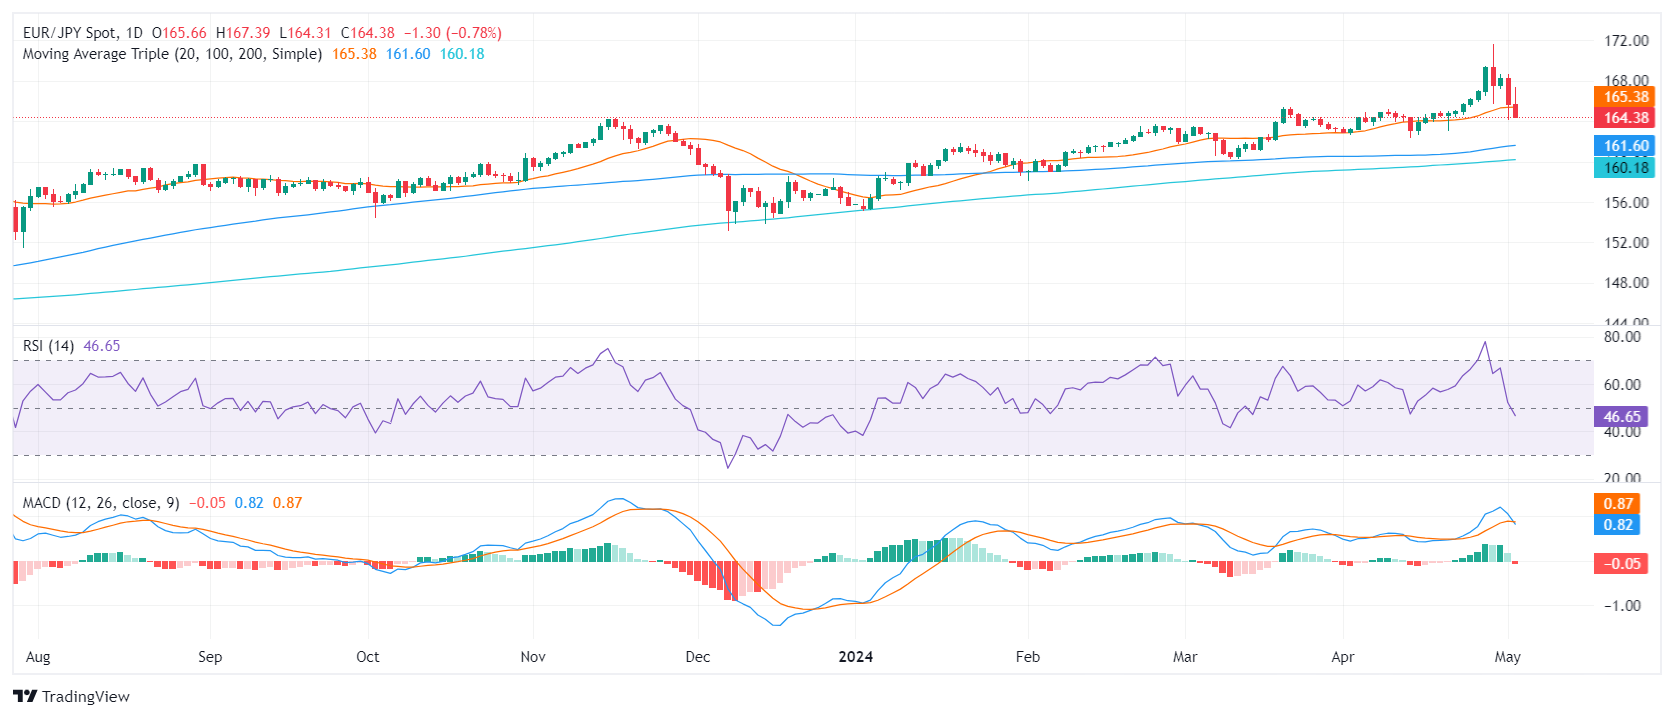
- The daily RSI for EUR/JPY highlights a decline from overbought levels to negative territory, showing selling dominance.
- Like the RSI, the daily MACD is showing increasing negative momentum.
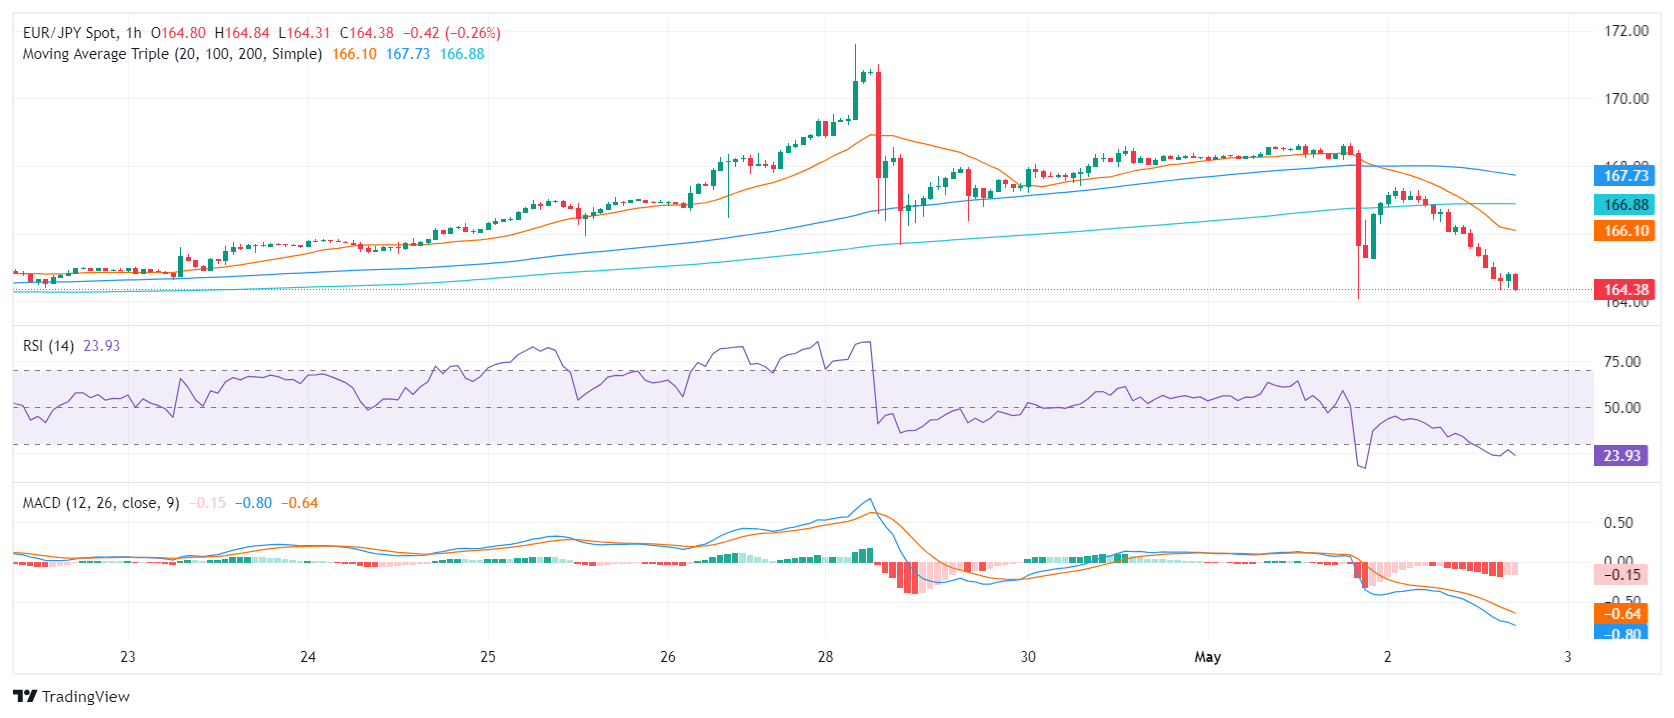
- On the hourly chart, low RSI values and flat MACD histogram in red hint at a short-term bearish trend.
The EUR/JPY pair is trading at 164.65, posting heavy losses on Thursday. Despite increasing selling pressure, long-term optimism remains intact, but the bears are asserting their position as they reclaimed the 20-day SMA, worsening the near-term outlook.
On the daily chart, the RSI for EUR/JPY has fallen from overbought readings to negative territory. The data suggests bearish momentum, indicative of a current dominant presence of sellers. At the same time, the moving average convergence divergence (MACD) histogram recorded new red bars, confirming growing negative momentum.
EUR/JPY daily chart
On the hourly chart, the RSI values remain at low levels and in oversold territory. On the hourly chart, the MACD aligns with the daily chart, showing red bars that point to further negative momentum in the near term.
EUR/JPY hourly chart
 From a broader perspective, EUR/JPY saw a significant reversal, falling below the 20-day simple moving average (SMA). This suggests a possible short-term bearish trend, but as long as the pair maintains positions above the more extended 100-day and 200-day SMAs, the overall outlook will be positive.
Source: Fx Street
I am Joshua Winder, a senior-level journalist and editor at World Stock Market. I specialize in covering news related to the stock market and economic trends. With more than 8 years of experience in this field, I have become an expert in financial reporting.


