
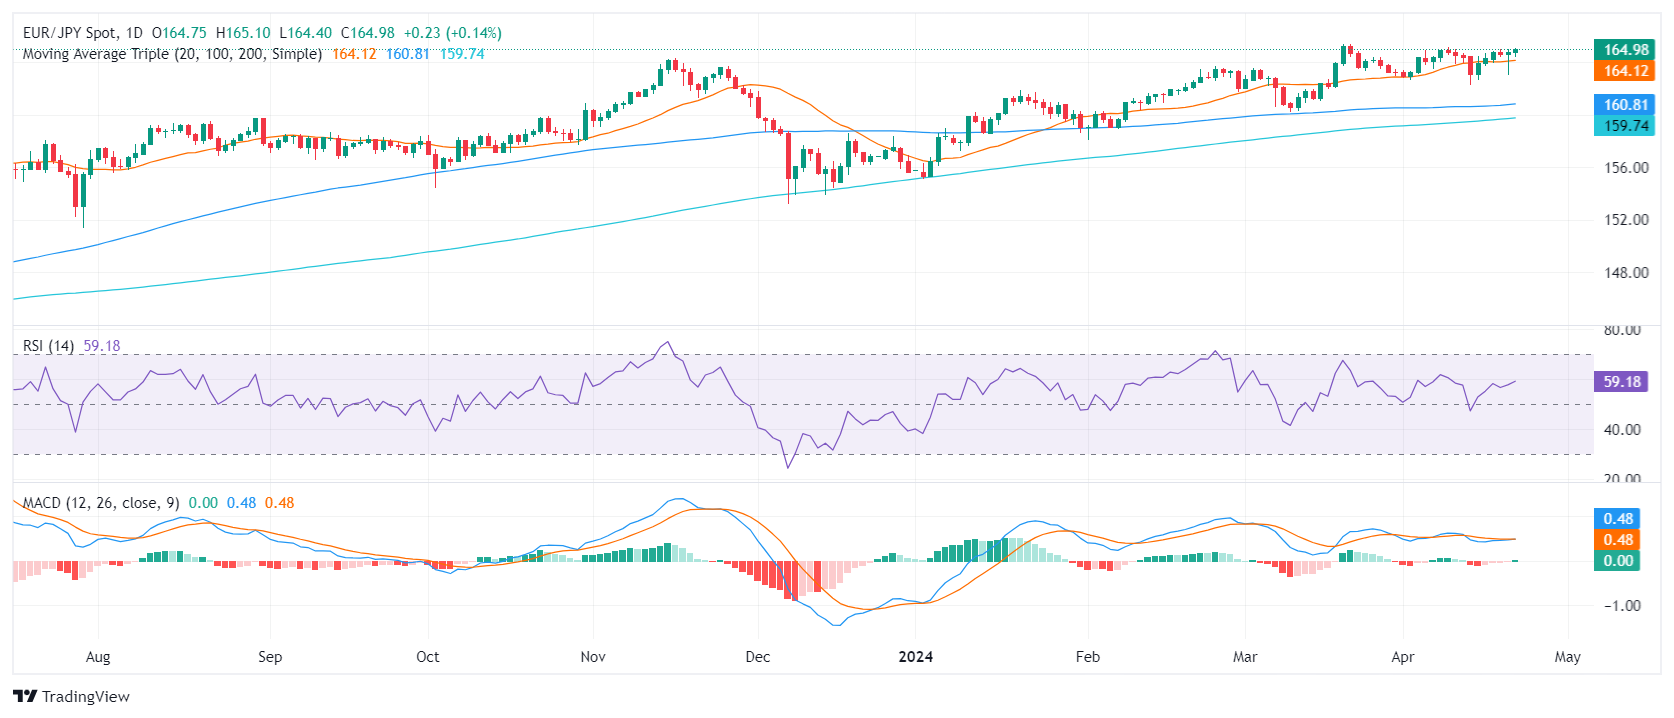
- The EUR/JPY daily chart shows increasing buying momentum, thanks to the strengthening RSI and MACD.
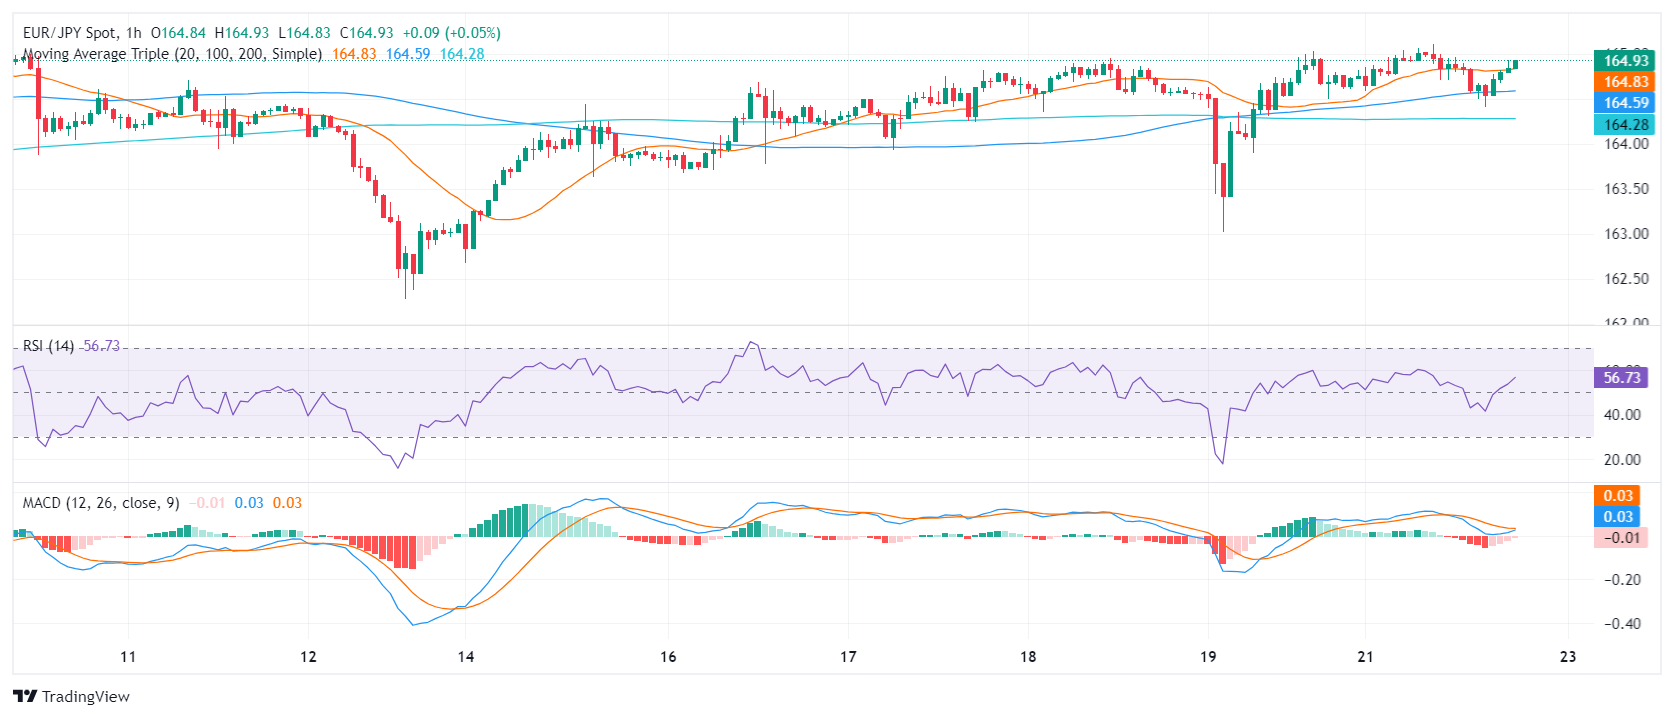
- The hourly chart shows a change in market dynamics as indicators favor buyers.
- Simple moving averages underline EUR/JPY's superiority, hinting at long-term upside potential.
The EUR/JPY pair is located at 164.88, showing slight gains in Monday's session. The pair exhibits strong bullish momentum which is reflected in the strengthening of the indicators on the hourly and daily charts.
On the daily chart, the RSI indicates a continued rise towards the upper boundaries, reinforcing the bullish momentum. The Moving Average Convergence Divergence (MACD) supports this positive momentum through new green bars, indicating strong buying dominance.
EUR/JPY daily chart
On the hourly chart, the RSI has shown a divergence from negative to positive territory, ranging between a low of 40 and a high of 56, suggesting a recovery of buyers in the session. The hourly MACD supports this idea as it prints decreasing red bars.
EUR/JPY hourly chart
Assessing the broader market outlook, based on the simple moving average (SMA), the pair's position above the 20-day, 100-day, and 200-day SMA points towards a possible long-term positive trend. As long as buyers keep the price above these key levels, the outlook remains favorable.
Source: Fx Street
I am Joshua Winder, a senior-level journalist and editor at World Stock Market. I specialize in covering news related to the stock market and economic trends. With more than 8 years of experience in this field, I have become an expert in financial reporting.


