
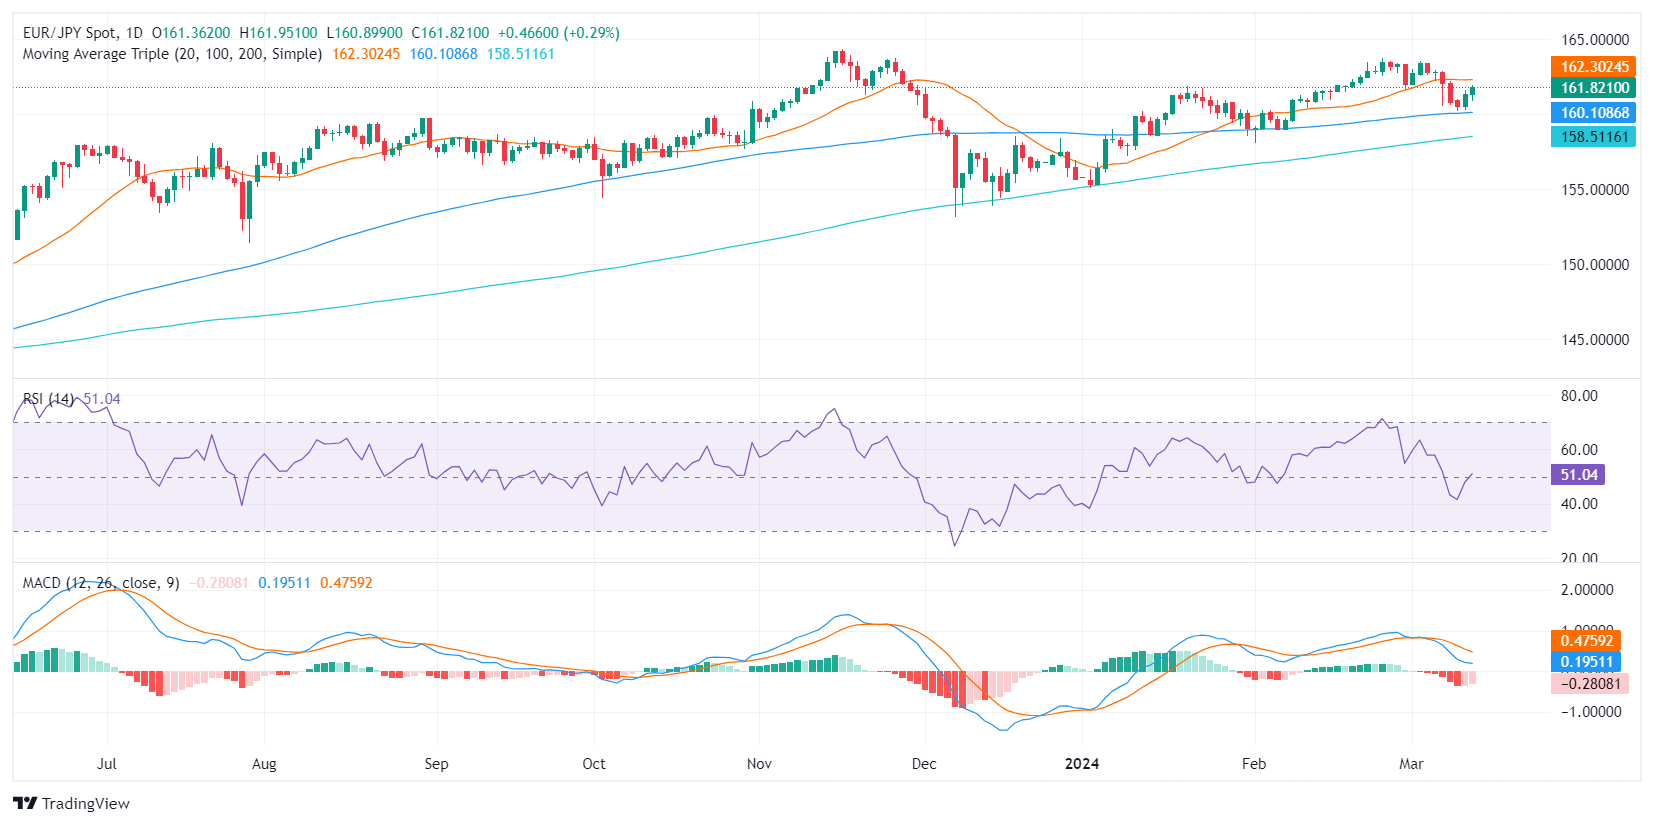
- The RSI on the daily chart for EUR/JPY reveals increasing buying momentum, while the MACD in contrast may suggest continued bearish sentiment.
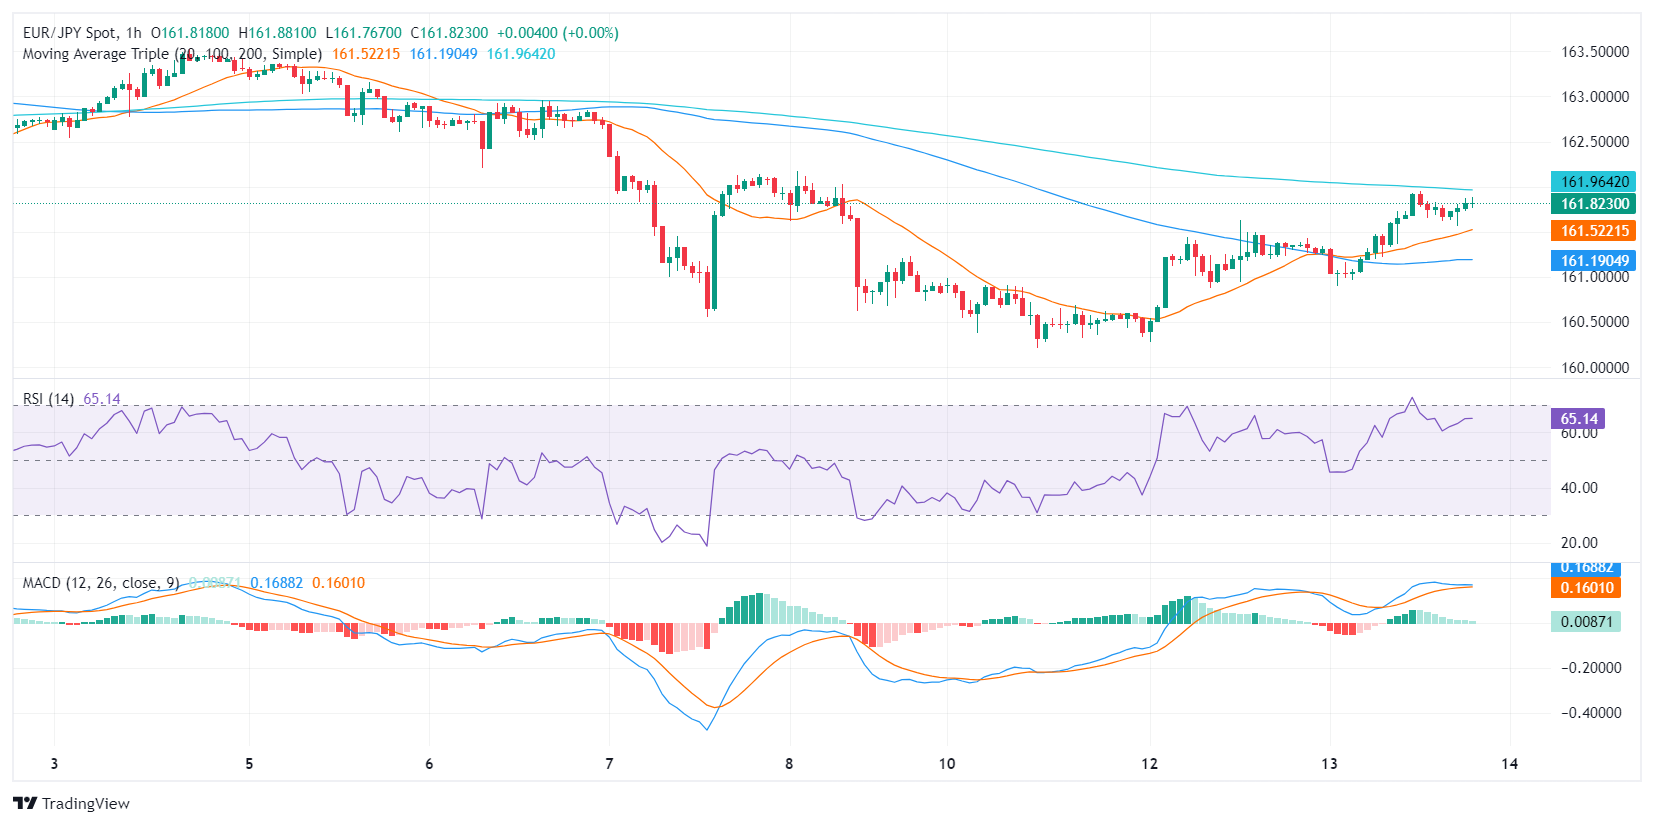
- The hourly RSI is approaching overbought, so the pair could consolidate in the coming hours.
The EUR/JPY pair remains at 161.83, with a gain of 0.31%. In the shorter time frames, the indicators gained ground and are close to overbought, which could indicate that the pair will consolidate in the coming hours. Overall, the outlook remains bullish, but buyers need to reclaim the 20-day SMA to make the near-term outlook more positive.
On the daily chart for EUR/JPY, the Relative Strength Index (RSI) is showing a positive trend. It has moved from negative to positive territory, indicating greater buying momentum. However, the decreasing red moving average convergence divergence (MACD) bars imply bearish but less intense momentum.
EUR/JPY Daily Chart
On the hourly chart of EUR/JPY, the RSI rose to around 60, coinciding with the daily positive momentum. However, despite the strong buying pressure, the MACD presents flat green bars, suggesting a stagnation of the bullish momentum. This reflects a possible consolidation phase for the rest of the session.
EUR/JPY hourly chart
Technically, even though the bears have dragged the EUR/JPY below the 20-day SMA, it remains above the 100- and 200-day SMA. This indicates that the bulls continue to control the market on longer timeframes. The buy signals indicated by the RSI on both the daily and hourly charts are slightly overshadowed by the stagnation of the MACD on the hourly chart, as buyers could start taking profits in the coming hours.
Source: Fx Street
I am Joshua Winder, a senior-level journalist and editor at World Stock Market. I specialize in covering news related to the stock market and economic trends. With more than 8 years of experience in this field, I have become an expert in financial reporting.


