
- The daily chart analysis of EUR/JPY reveals strong buying momentum, as indicated by the RSI and MACD in positive territory.
- On the daily and hourly chart, the MACD shows increasing buying traction, reinforcing the bullish trend.
- The pair's position above the crucial simple moving averages indicates a prolonged bullish phase.
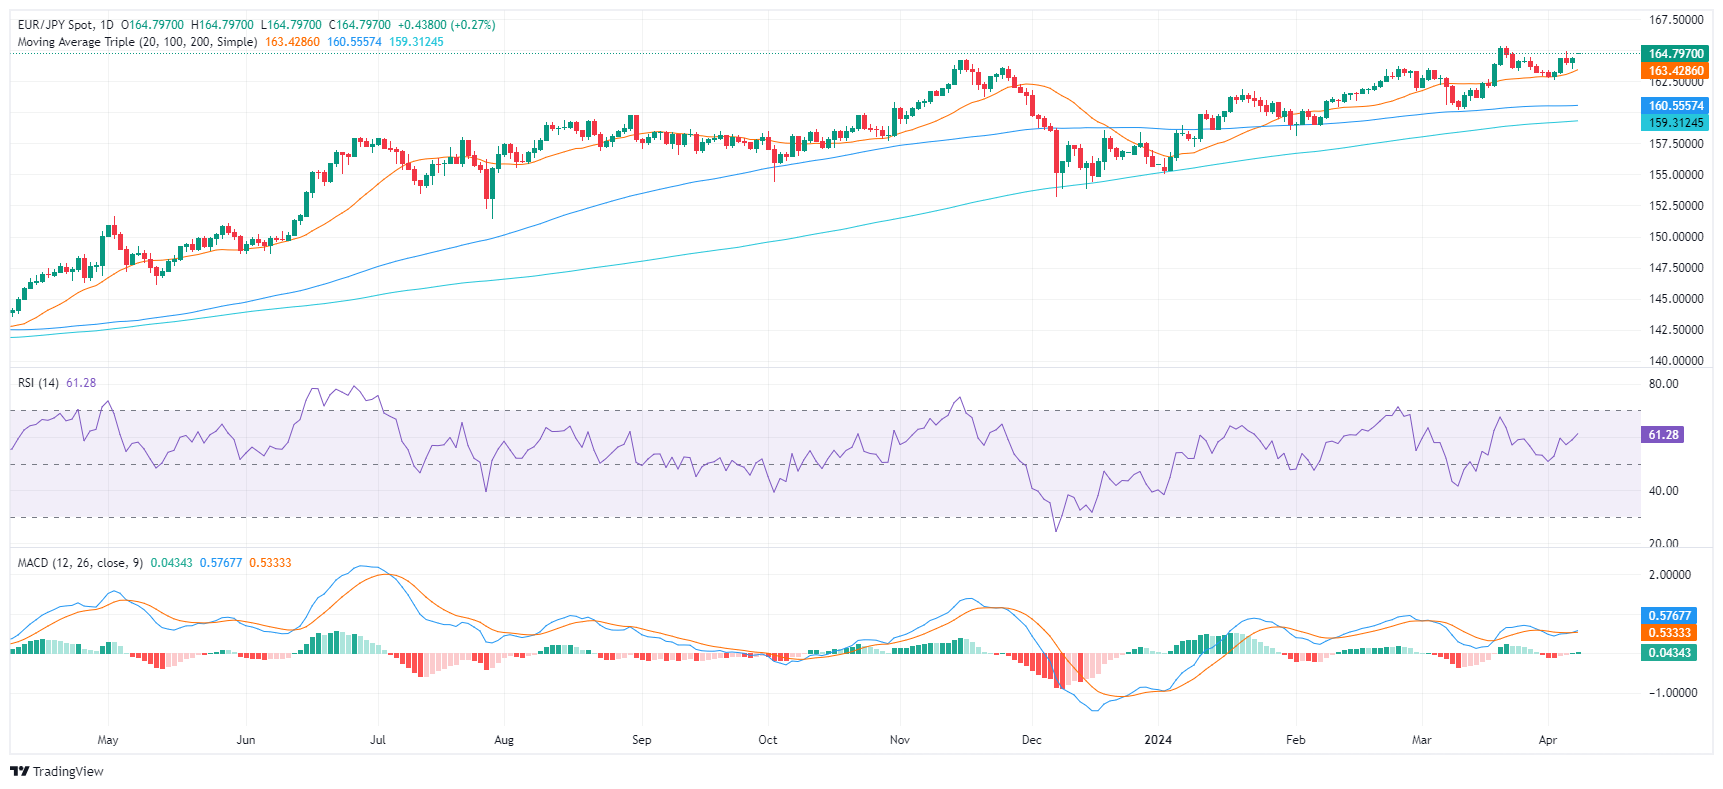
The EUR/JPY pair is currently trading at 164.78, with a daily gain of 0.28%. This suggests a probable continuation of the bullish phase, well positioned above the essential Simple Moving Averages (SMA). The current market stance indicates the dominance of buyers, and long positions look favorable.
On the daily chart, the Relative Strength Index (RSI) is in positive territory, around 62, close to the overbought zone, suggesting quite powerful buying pressure. At the same time, the moving average convergence divergence (MACD) shows ascending green bars, indicating positive momentum.
EUR/JPY daily chart
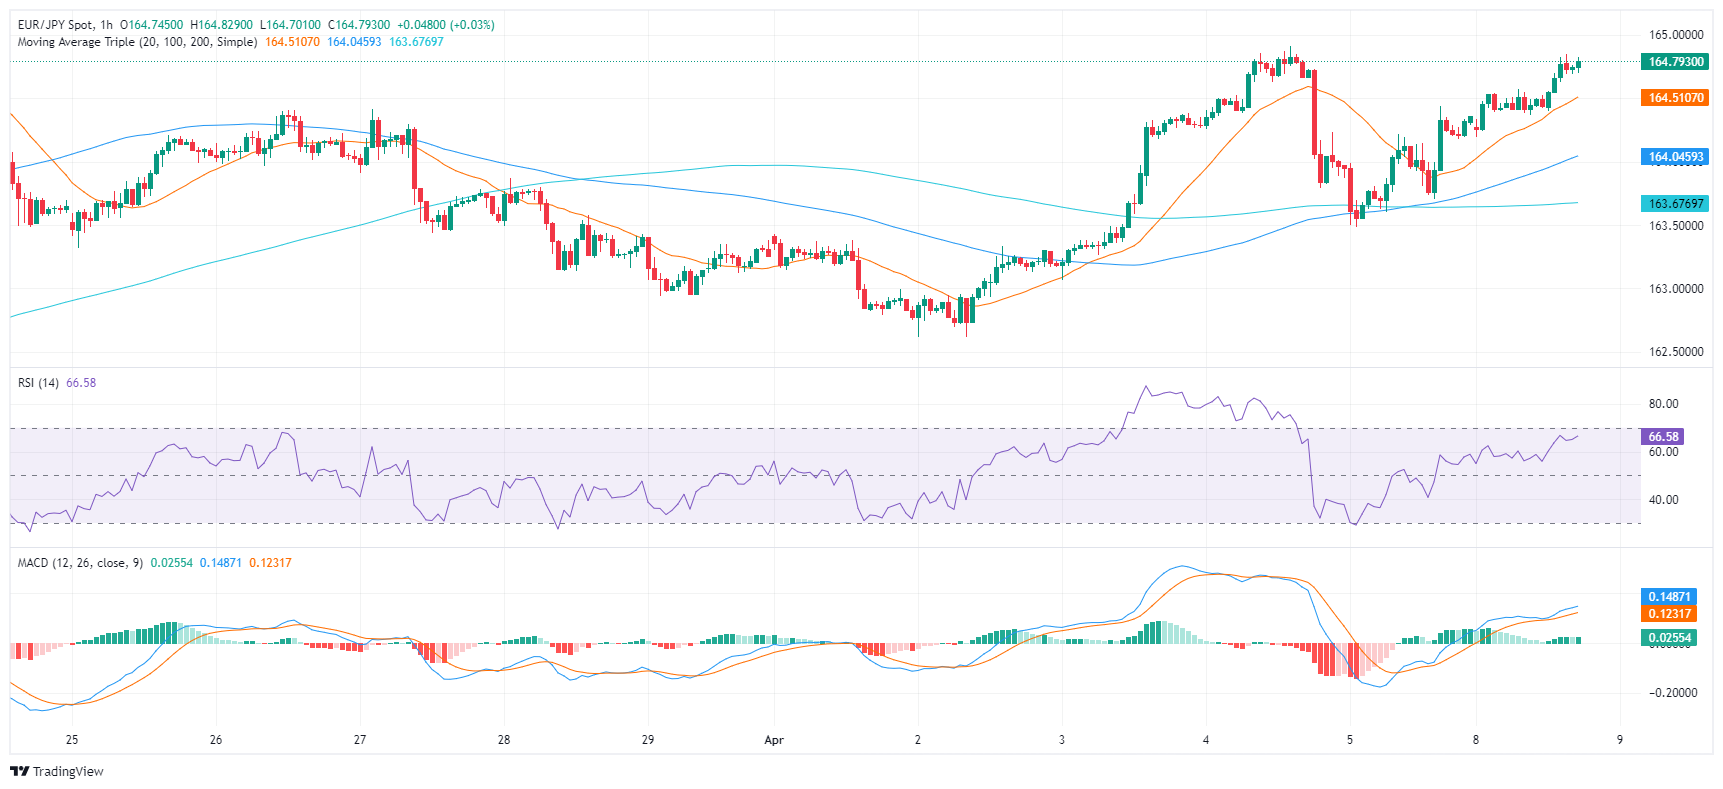
On the hourly chart, the RSI shows a similar bullish sentiment as its latest reading is recorded at 67. The MACD remains in line with the daily chart as it shows an emerging green bar, indicating reinforced positive momentum. This corroborates the dominance of buyers in this time frame as well.
EUR/JPY hourly chart
Taking the bigger picture into account, EUR/JPY appears to be in a strong position, standing above the 20-day, 100-day and 200-day SMA. The SMAs are crucial as positions above these levels suggest a predominant uptrend. The further above the SMA, the stronger the bullish sentiment.
Source: Fx Street
I am Joshua Winder, a senior-level journalist and editor at World Stock Market. I specialize in covering news related to the stock market and economic trends. With more than 8 years of experience in this field, I have become an expert in financial reporting.


