
- EUR/JPY bounced from daily lows at 139.03 and reached a daily high of 141.19 before losing strength.
- The recovery in EUR/JPY and the achievement of a daily close above the 200 day EMA keeps the bulls hoping for a price rally.
The euro (EUR) picks up strongly on Friday, ahead of the weekend, while the japanese yen (JPY) weakens after the monetary policy meeting of the Bank of Japan ( BOJ ), which maintains its dovish stance, and the Yield Curve Control (YCC). Therefore, EUR/JPY gains traction and trades at 140.63, above its opening price by more than 1%.
EUR/JPY Price Analysis: Technical Insights
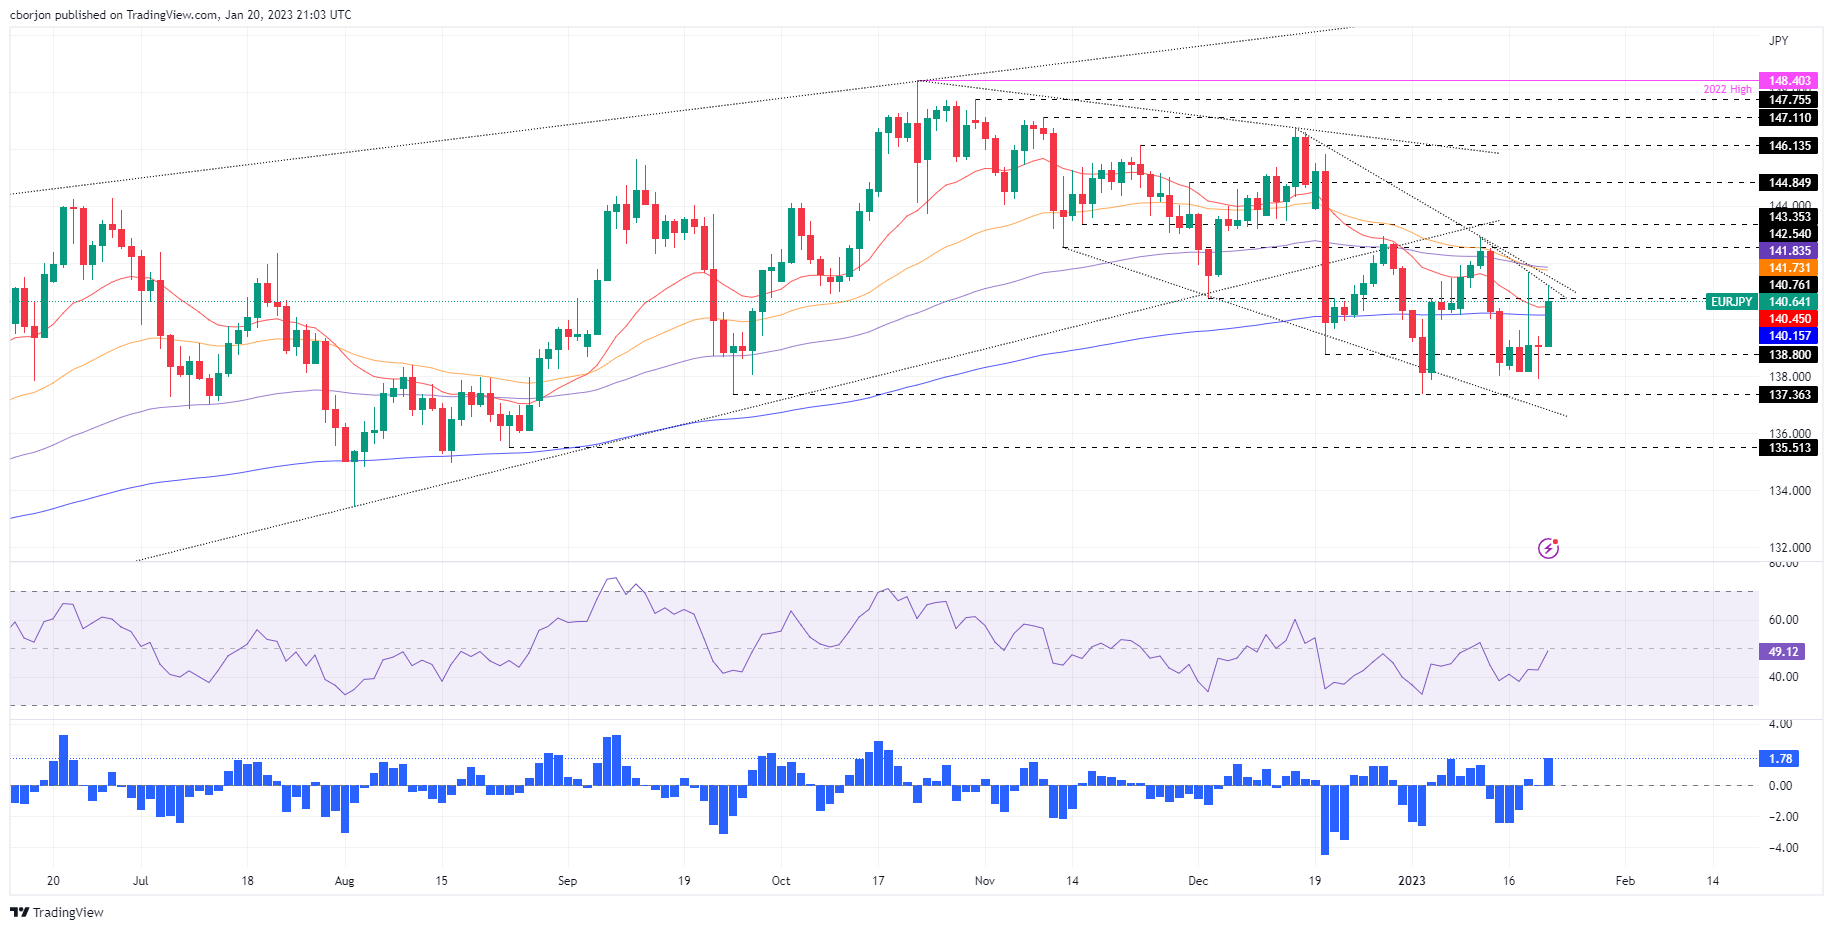
The daily chart of EUR/JPY shows the pair recapturing the 20 and 200 day EMAs, each at 140.45 and 140.15, respectively, keeping bulls hoping for higher prices. Furthermore, the Relative Strength Index (RSI) is heading north and is about to turn bullish, further consolidating the neutral-bullish bias, while the Rate of Change (RoC) portrays strong bullish sentiment in the pair.
Therefore, the path of least resistance for the EUR/JPY is bullish. Therefore, the first resistance for EUR/JPY would be the Jan 20 high at 141.19, followed by the Jan 18 daily high at 141.68, and the figure at 142.00. As an alternate scenario, if EUR/JPY fails to break above 141.00 it could pave the way lower. Key support levels for the EUR/JPY would be the psychological level of 140.00, followed by the January 20 daily low at 139.03, and then the January 19 low at 137.91.
Key Technical Levels for EUR/JPY
Source: Fx Street
I am Joshua Winder, a senior-level journalist and editor at World Stock Market. I specialize in covering news related to the stock market and economic trends. With more than 8 years of experience in this field, I have become an expert in financial reporting.


