
- The EUR/JPY pair rallied in the session on Tuesday, with gains of over 1%.
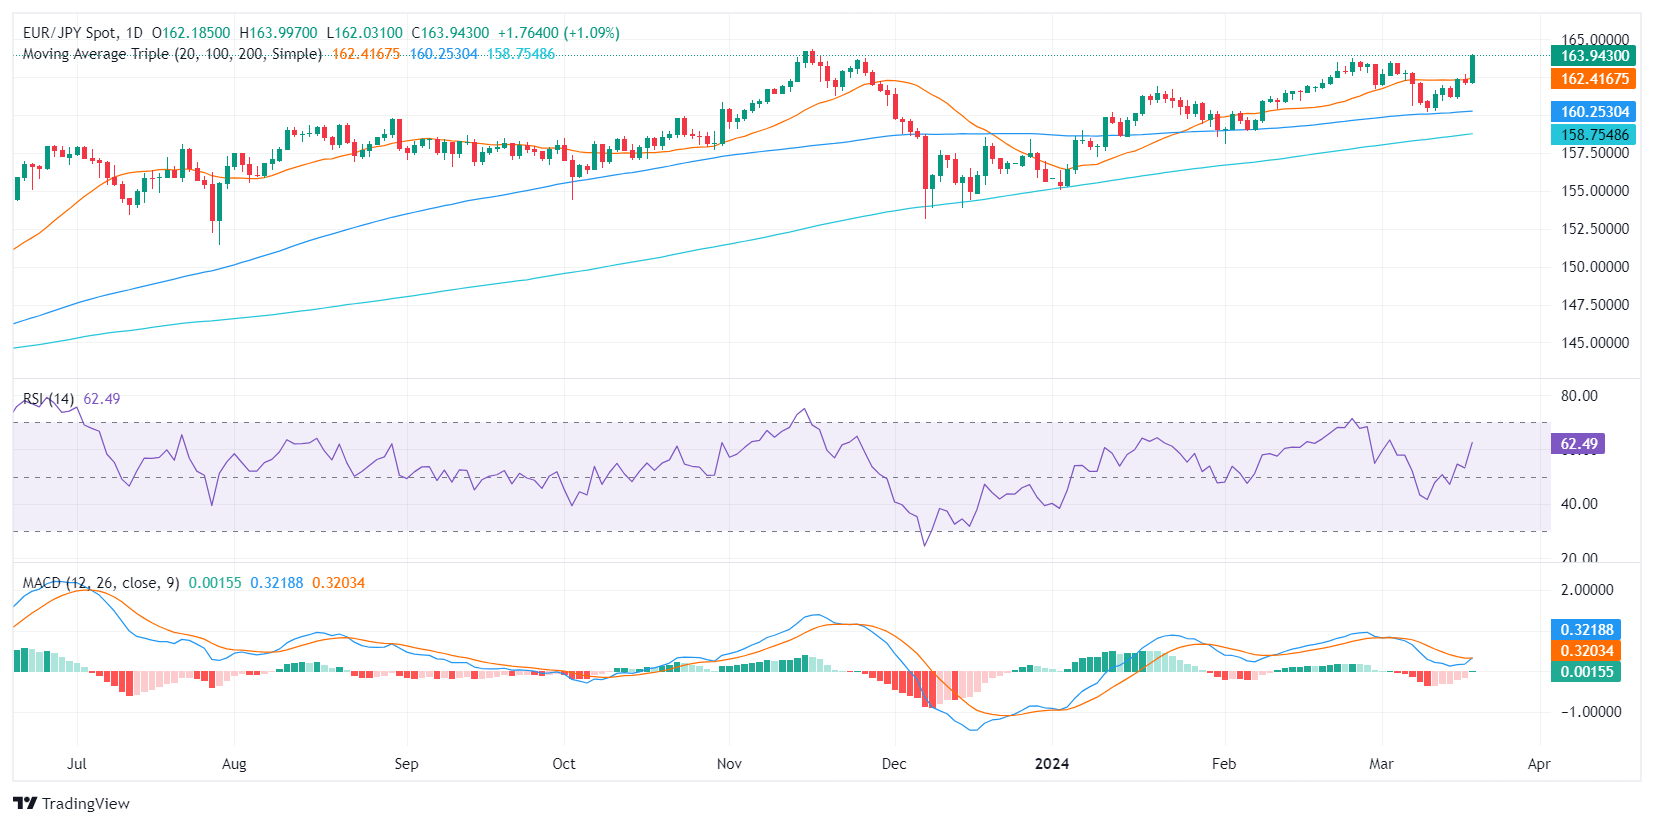
- The daily RSI shows increasing buying momentum, in positive territory.
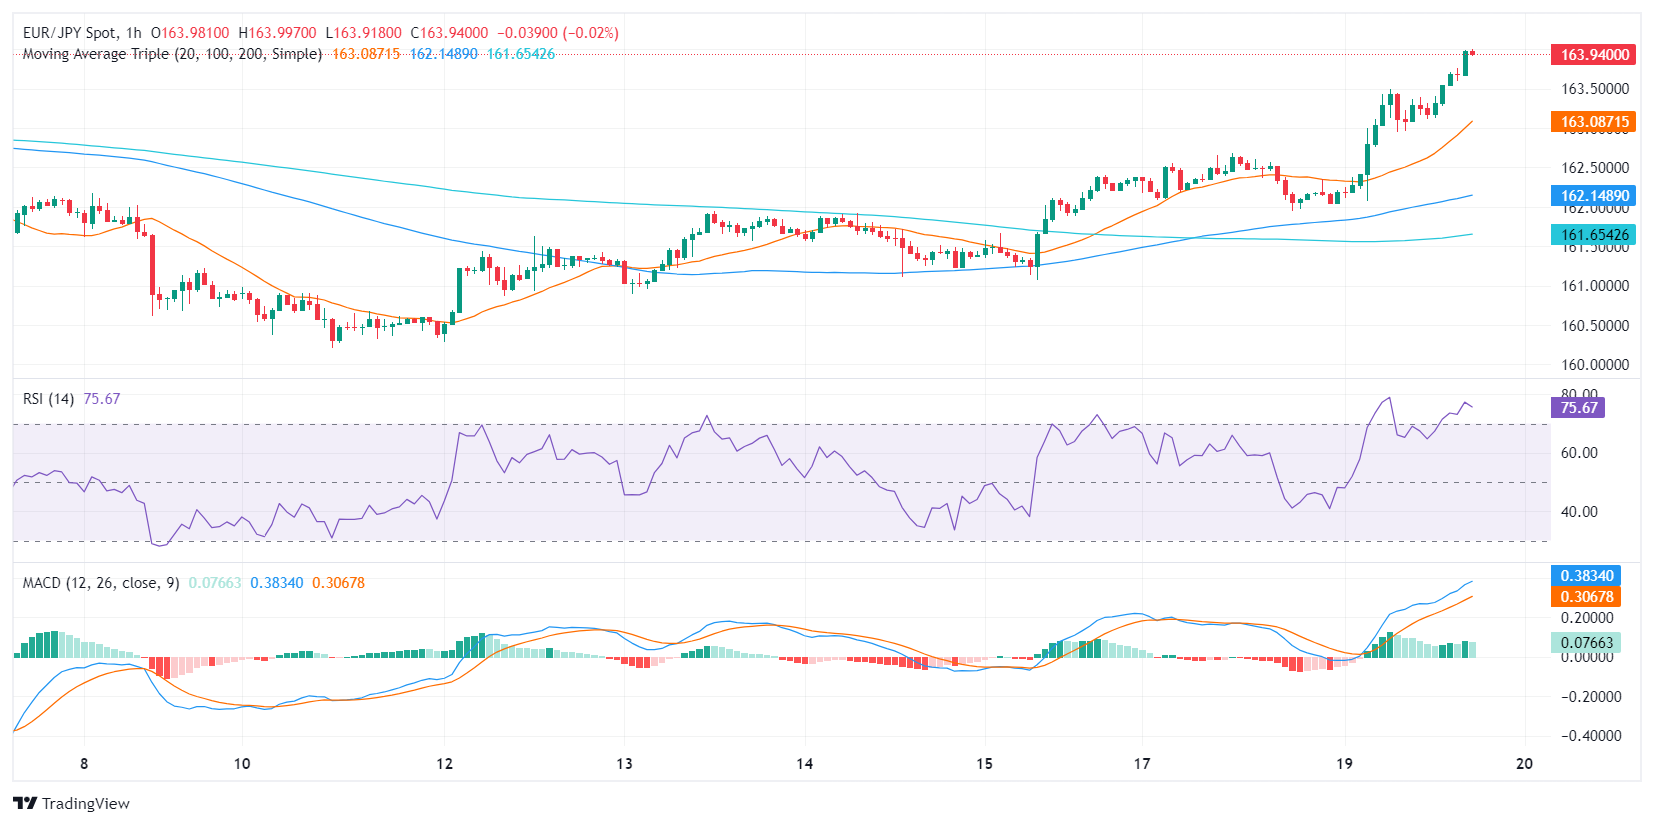
- The hourly chart hints at overbought conditions, and the RSI holding above 70 signals the possibility of profit-taking selling.
In the Tuesday session, the EUR/JPY pair is trading around the 164.00 zone, marking a strong rally of 1.14%. On the hourly chart, overbought conditions suggest consolidation.
On the daily chart, the pair is exhibiting increasing momentum, as indicated by the latest Relative Strength Index (RSI) values. From negative territory, the RSI's recent trajectory consolidated into positive territory, recently reaching a high of 65 that is approaching overbought status. Currently, buyers dominate the market, leading to the possibility of the pair moving into overbought conditions soon.
EUR/JPY daily chart
On the hourly chart, the EUR/JPY pair shows persistent overbought conditions. The RSI values remain firm and above 70, suggesting intense buying pressure. The Moving Average Convergence Divergence (MACD) reinforces this bullish momentum with its ascending green bars. However, these overbought conditions could soon trigger a bearish correction, as the overbought could lead to profit-taking selling.
EUR/JPY hourly chart
In conclusion, both the daily and hourly charts show strong buying momentum. The positive outlook is corroborated by the fact that the pair is trading above the main 20-day, 100-day, and 200-day SMA. Any bearish correction that keeps the pair above these levels will not affect the overall uptrend.
Source: Fx Street
I am Joshua Winder, a senior-level journalist and editor at World Stock Market. I specialize in covering news related to the stock market and economic trends. With more than 8 years of experience in this field, I have become an expert in financial reporting.


