
- EUR/JPY rises but stalls around 142.00, the confluence of the pattern and the 100 DMA.
- EUR/JPY would turn bullish above 142.00; otherwise, it could fall towards 141.00.
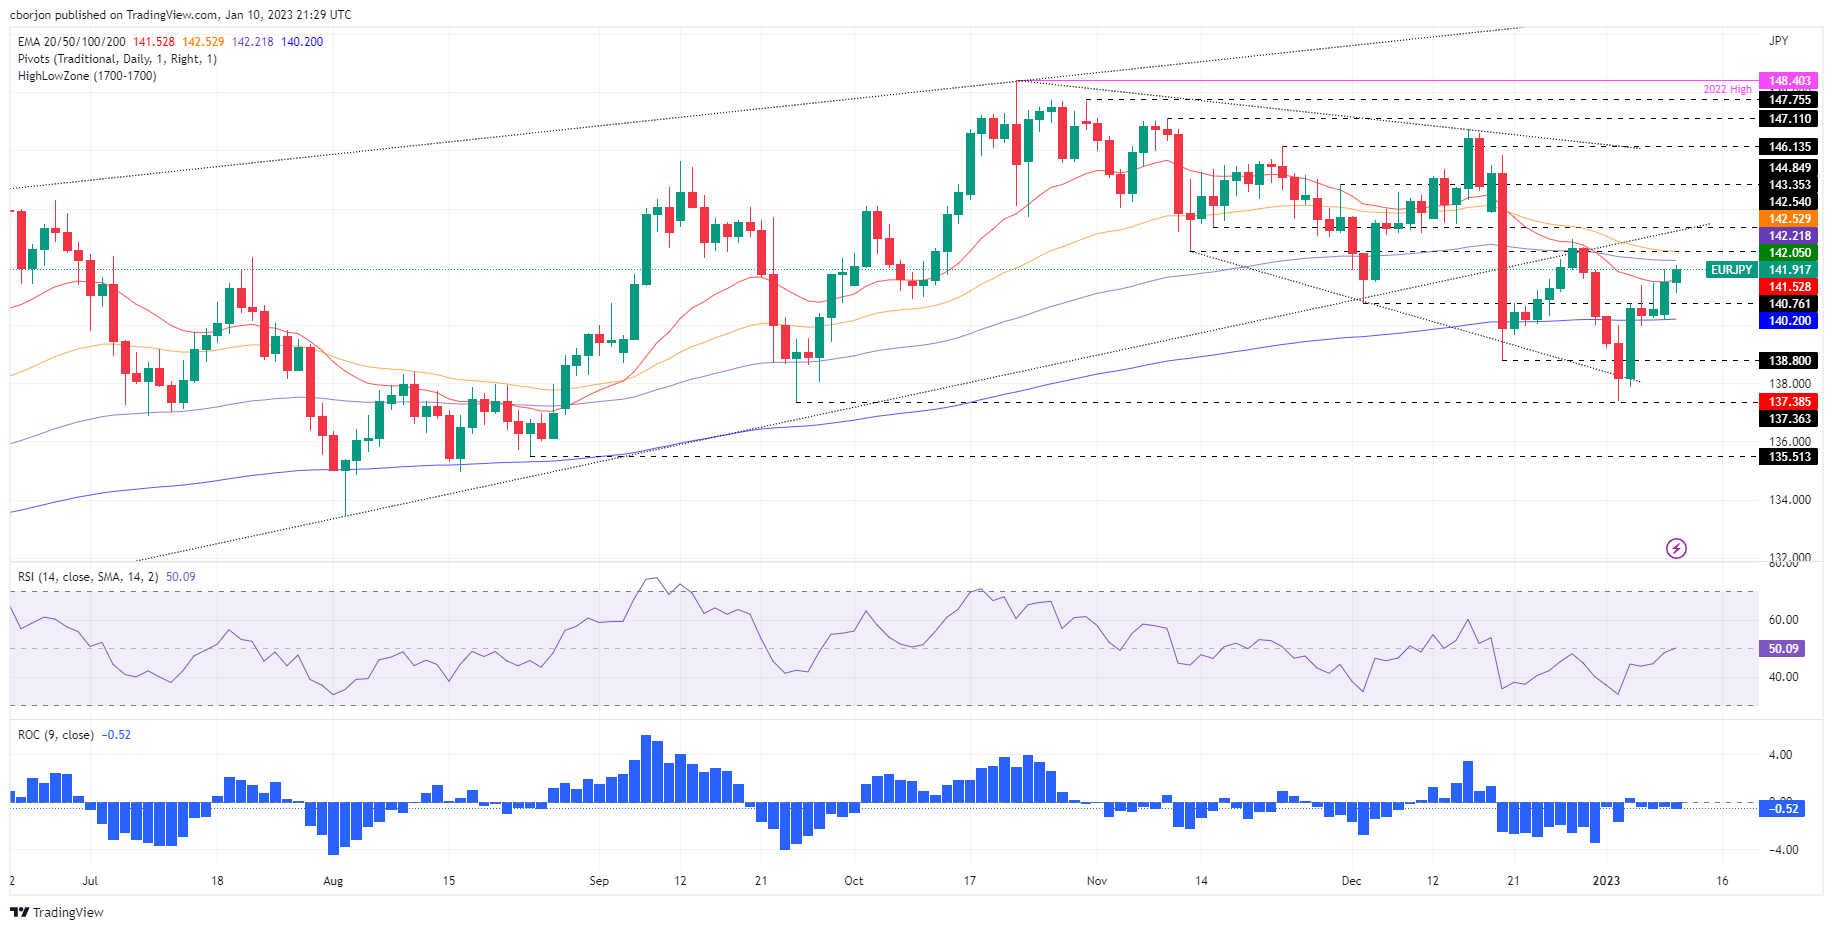
EUR/JPY extends its gains to three straight sessions, up 0.38%, as Wall Street ended Tuesday’s session with solid gains. On its way to fresh two-week highs, the EUR/JPY broke above the 20-day EMA at 141.53 and is about to test the 100-day EMA at 142.22. At press time, the EUR/JPY pair is trading at 141.97.
EUR/JPY Price Analysis: Technical Insights
The daily chart of the currency pair suggests that buyers are still in control after breaching the 200 day EMA on January 4th around 140.16. To continue its uptrend, the EUR/JPY needs to retrace the 142.00 figure, although it would face solid resistance around the 100 day EMA. If EUR/JPY breaks the latter, it will clear the way towards the 50-day EMA at 142.50, followed by the 1430.0 zone.
However, if the EUR/JPY rally stalls out at 142.00, the pair could test the downside 20-day EMA around 141.53. Once the 20-day EMA is broken, the pair would head towards 141.53. Once broken, EUR/JPY will slide towards 141.00, to later challenge the 200 day EMA at 140.20.
Key Technical Levels for EUR/JPY
Source: Fx Street
I am Joshua Winder, a senior-level journalist and editor at World Stock Market. I specialize in covering news related to the stock market and economic trends. With more than 8 years of experience in this field, I have become an expert in financial reporting.


