
- EUR/JPY consolidates its recent strong gains and hits its highest level since September 2008.
- The overbought RSI on the daily chart prevents bulls from opening new positions and limits the pair’s upside.
- A weakness below the daily low could pave the way for a significant corrective pullback.
The EUR/JPY cross continues to consolidate its movement for the second day in a row and oscillates between tepid gains and small losses in the early stages of the European session. The pair is currently trading around the 155.00 level, just below the highest level since September 2008 that it touched on Tuesday.
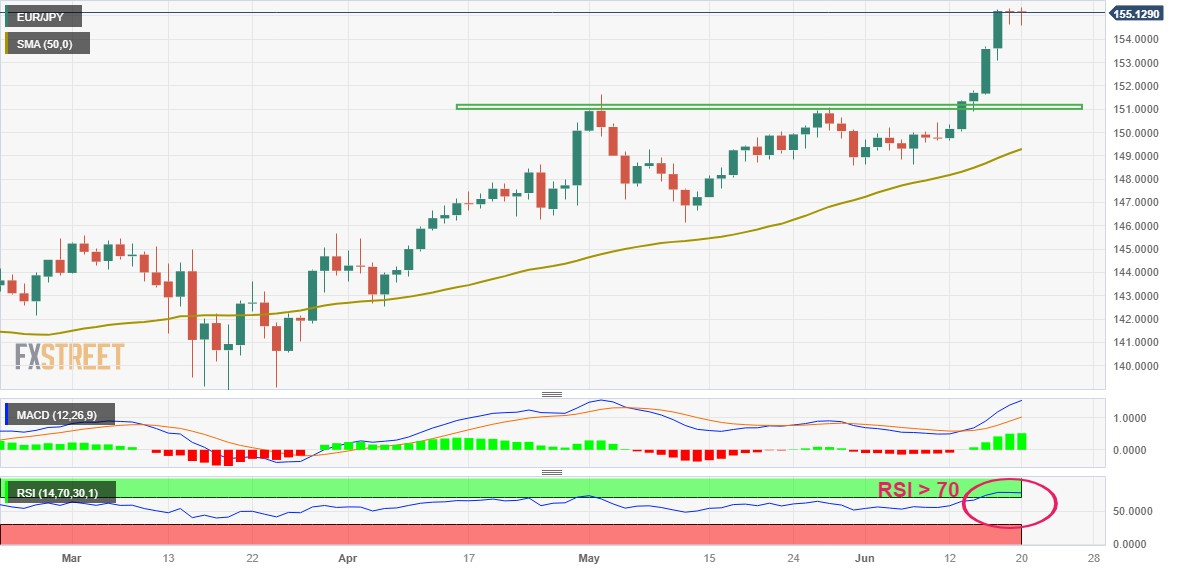
The large divergence in the monetary policy stance adopted by the Bank of Japan (BoJ) and the European Central Bank (ECB) is seen as a key factor acting as a tailwind for the EUR/JPY cross. Even from a technical perspective, last week’s sustained break above the strong horizontal resistance at 151.00 was seen as a new trigger for the bulls. This, in turn, supports the prospects for a further appreciation move in the near term.
That being said, the weaker tone in equity markets is lending some support to the safe-haven Japanese Yen (JPY) and capping EUR/JPY’s upside. Elsewhere, the Relative Strength Index (RSI) on the daily chart remains well above 70, showing overbought conditions and holding traders back from entering new bullish positions, although any significant corrective pullback still looks difficult. reaching.
Therefore, a pullback towards the daily low, around the 154.60-154.55 area, could be seen as a buying opportunity and remain limited. That being said, a sustained break below that level could trigger some technical selling and accelerate the slide towards 154.00. Further down, the EUR/JPY pair could drop to the 153.65-153.55 zone, which would act as a solid base and key point for short-term traders.
On the other hand, bulls could wait to break above the 155.35-155.40 zone, a multi-year high, before positioning for further gains. EUR/JPY could then pick up momentum towards the 156.00 zone on its way to the next major hurdle near the 156.30-156.40 region. Higher up, the cross could try to recapture the 157.00 level, although the overbought RSI advises some caution for aggressive bulls.
EUR/JPY daily chart
EUR/JPY additional technical levels
Source: Fx Street
I am Joshua Winder, a senior-level journalist and editor at World Stock Market. I specialize in covering news related to the stock market and economic trends. With more than 8 years of experience in this field, I have become an expert in financial reporting.


