
- EUR/JPY adds to Monday’s pullback, at the 136.00 barrier zone.
- Upside attempts remain capped by the August high at 138.40.
EUR/JPY continues the bearish start of the week, although it manages to bounce from the lows around 135.70.
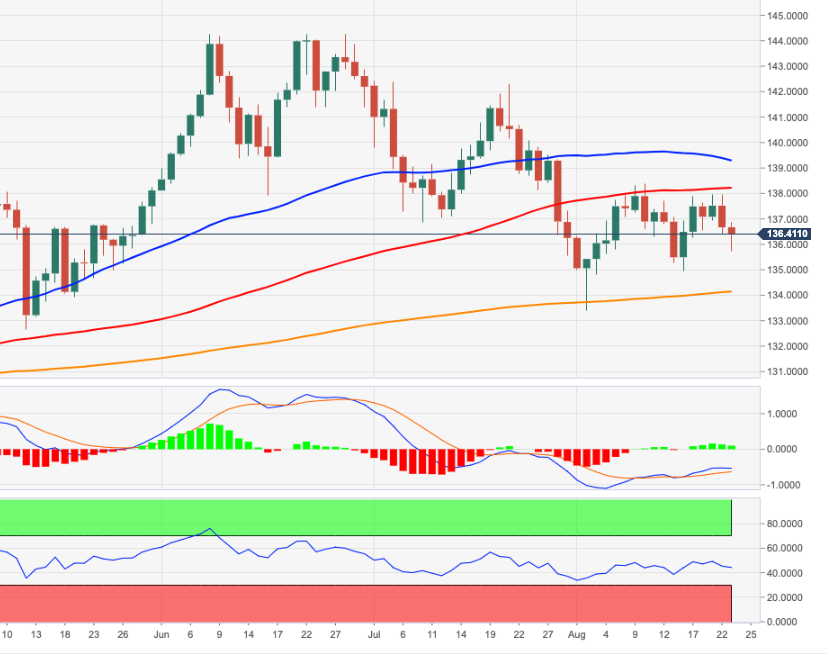
If the cross manages to break above the ongoing consolidation, the August high at 138.39 (Aug 10) is expected to be back in the spotlight. Above the latter, EUR/JPY could attempt a move towards the 55-day simple moving average (SMA) today at 139.26.
As long as it remains above the 200-day SMA at 134.12, the outlook for the pair should remain constructive.
EUR/JPY day chart
Source: Fx Street
With 6 years of experience, I bring to the table captivating and informative writing in the world news category. My expertise covers a range of industries, including tourism, technology, forex and stocks. From brief social media posts to in-depth articles, I am dedicated to creating compelling content for various platforms.


