
- EUR/JPY advances towards new highs near 164.00.
- Overbought conditions discourage further increases.
He EUR/JPY continues to rise and flirts with 164.00 on Wednesday, new annual highs.
On the short-term horizon, it looks like the cross could continue to rise. On the contrary, the breakout of the 2023 high at 163.94 (November 15) is expected to face the next significant resistance level no earlier than the 2008 high at 169.96 (July 23).
Meanwhile, the daily RSI enters overbought territory near 74, opening the door for a possible short-term corrective move.
For now, the positive long-term outlook for the cross seems favored as long as it remains above the 200-day SMA, today at 152.46.
EUR/JPY daily chart
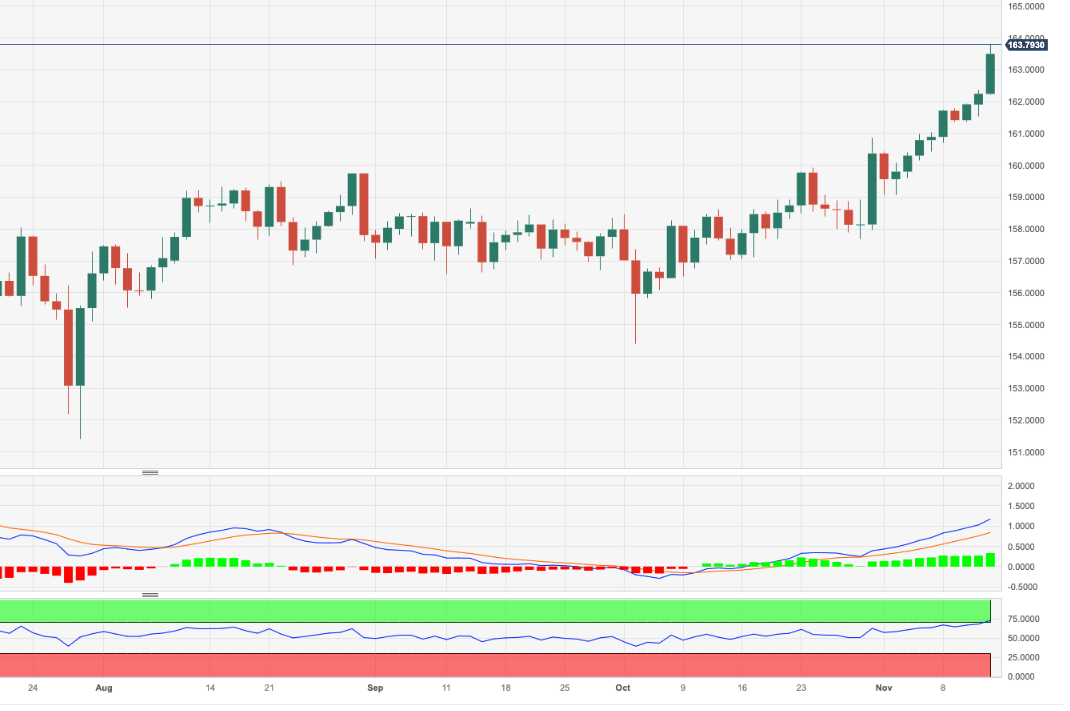
Source: Fx Street
I am Joshua Winder, a senior-level journalist and editor at World Stock Market. I specialize in covering news related to the stock market and economic trends. With more than 8 years of experience in this field, I have become an expert in financial reporting.


