
- EUR/JPY extends the decline for the second consecutive session.
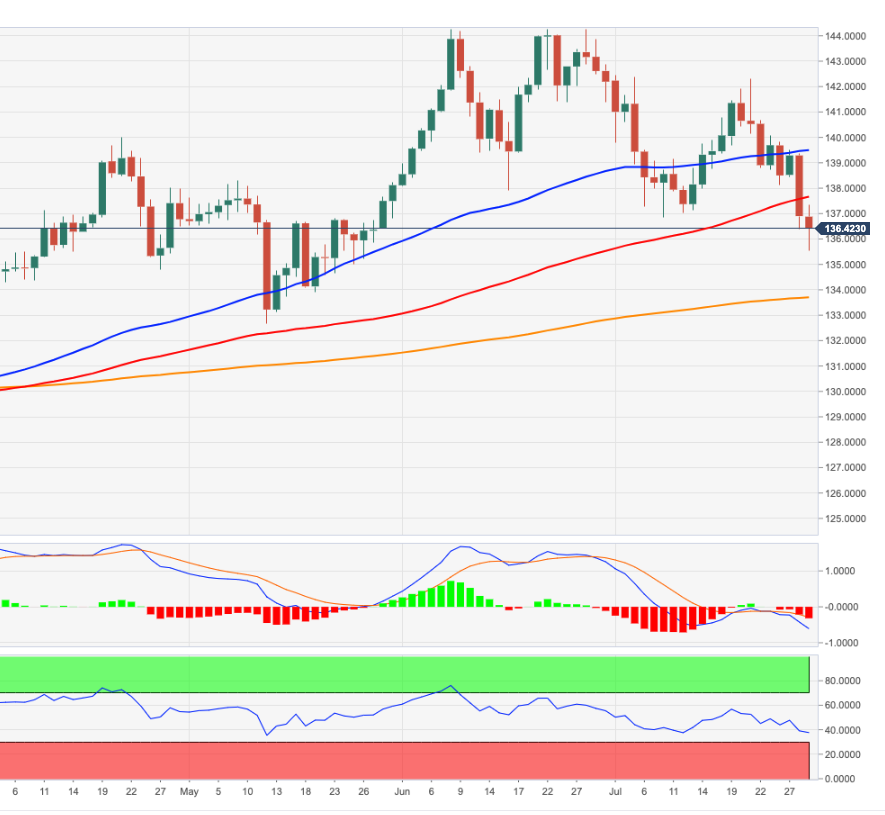
- The next downside zone emerges at the 200-day SMA at 133.66.
EUR/JPY accelerates the weekly pullback and has already tested fresh 2-month lows in the 135.50 area, where some initial containment seems to have emerged.
The cross remains under pressure and is vulnerable to further decline while below the weekly high at 142.32 (July 21). This week’s persistent decline now exposes a likely deeper drop to the critical 200-day simple moving average today at 133.67.
It is worth noting that as long as it is above the latter, the cross is expected to maintain its constructive stance.
EUR/JPY day chart
Source: Fx Street
With 6 years of experience, I bring to the table captivating and informative writing in the world news category. My expertise covers a range of industries, including tourism, technology, forex and stocks. From brief social media posts to in-depth articles, I am dedicated to creating compelling content for various platforms.


