
- EUR/JPY extends weekly bounce past 139.00.
- It is likely to continue to rise above resistance near 140.30.
EUR/JPY extends Wednesday’s move and recovers to the 139.00 zone and beyond on Thursday.
Further rallies should break above the 4-month resistance line around 140.30 to allow a continuation of the rally to initially the weekly high at 142.37 (5 Jul). Beyond the latter, the cross could attempt a visit to the 2022 high at 144.27 (June 28).
In the longer term, the constructive stance on the cross remains well supported by the 200 SMA at 133.26.
EUR/JPY day chart
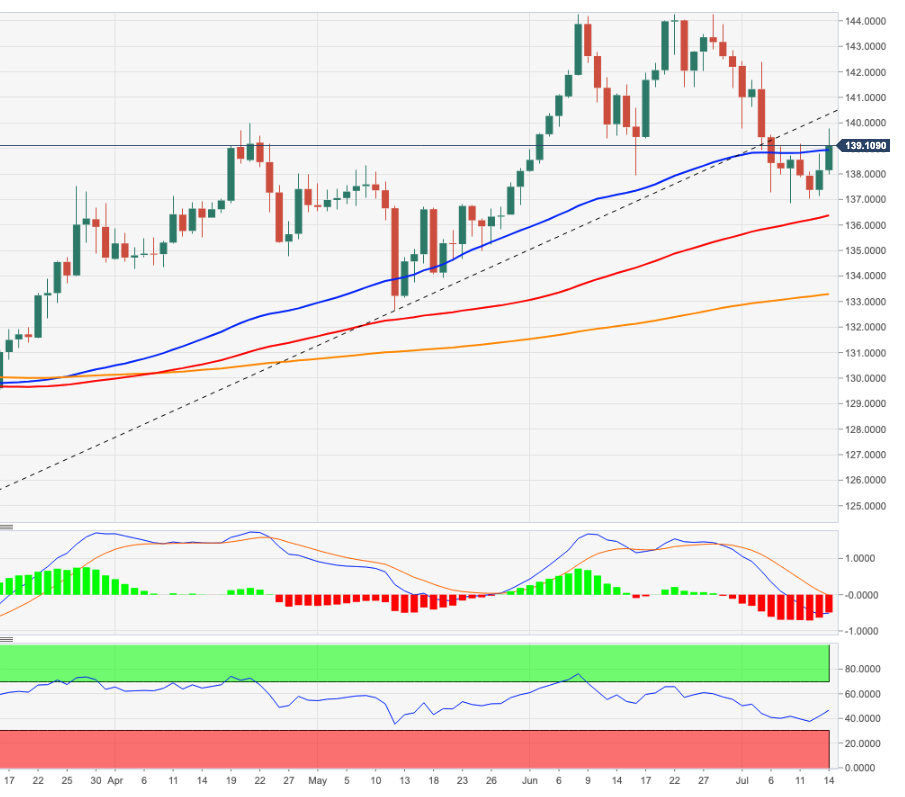
Source: Fx Street
With 6 years of experience, I bring to the table captivating and informative writing in the world news category. My expertise covers a range of industries, including tourism, technology, forex and stocks. From brief social media posts to in-depth articles, I am dedicated to creating compelling content for various platforms.


