
- EUR/JPY posted a new weekly high each day of the week.
- The shared currency strengthened once it broke above the 39.00 level following the EU inflation data.
- The negative divergence of the EUR/JPY and the RSI on the 4 hours chart suggests that the pair could pull back before testing 140.00.
The EUR/JPY extends its weekly gains for the fourth consecutive day, rising almost 0.50% during the day, as the American session is about to end. At the time of writing, the EUR/JPY is at 139.60, refreshing five-week highs, for the fourth day in a row.
EUR/JPY Price Analysis: Technical Outlook
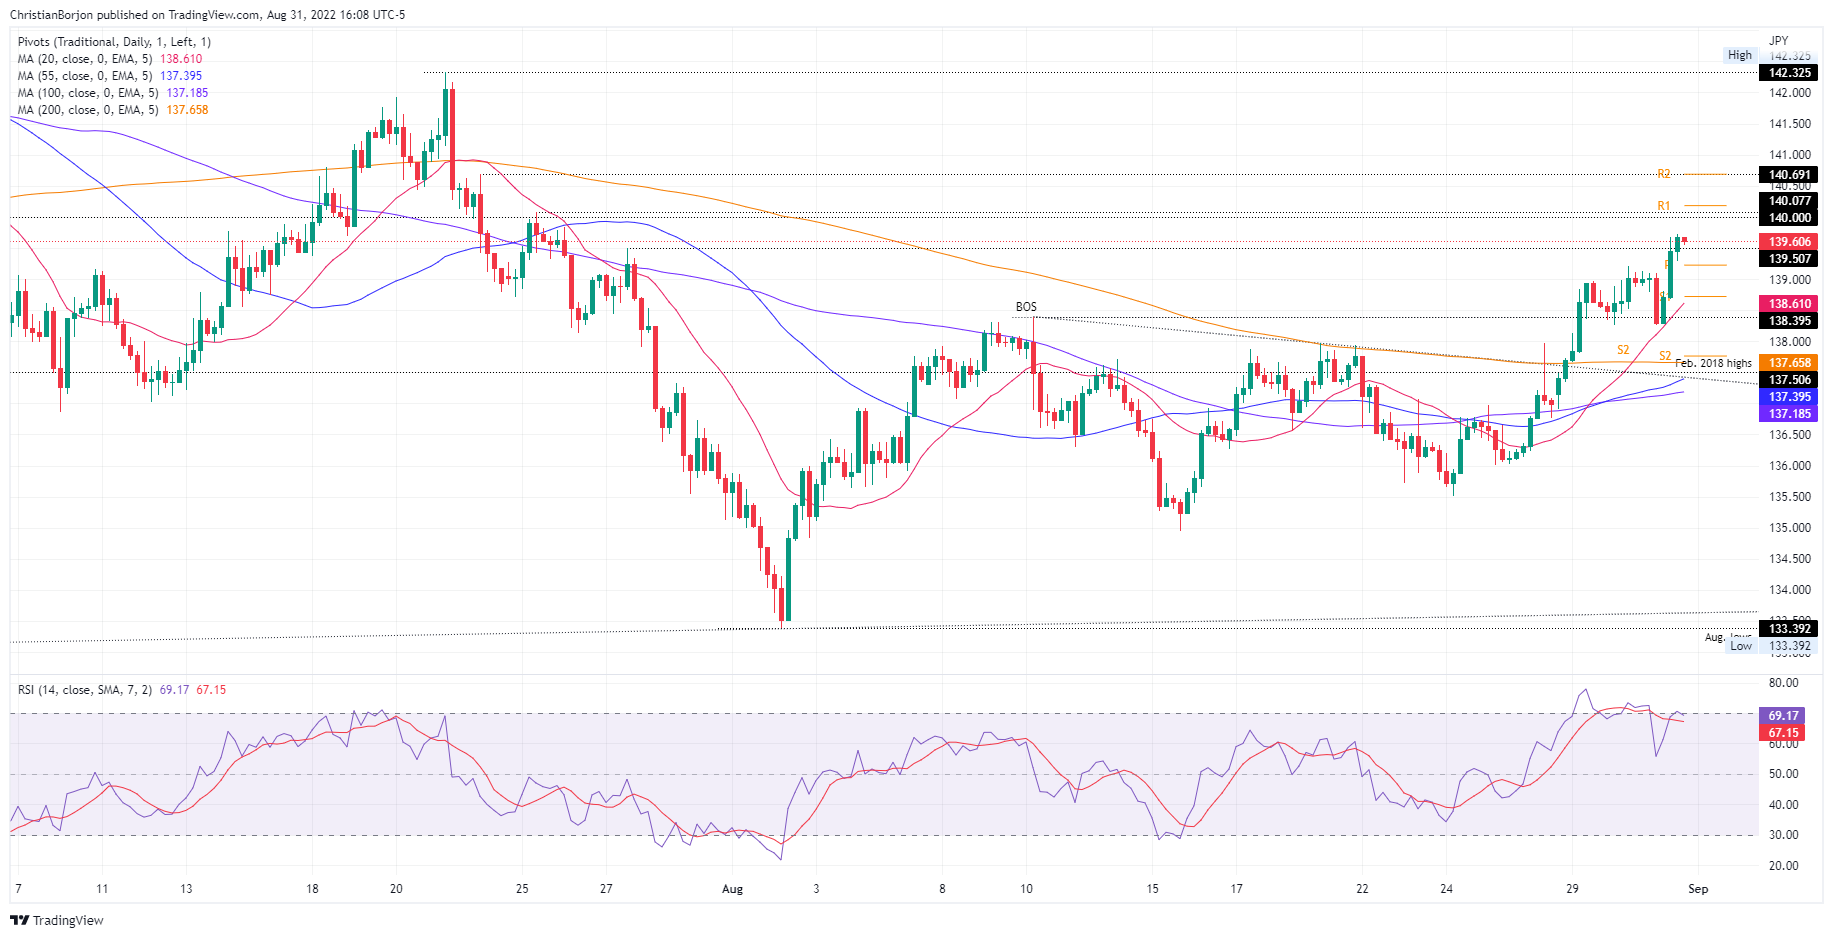
After consolidating around the 138.20-139.20 area, the currency cross resumed its uptrend. Data from the euro zone, showing inflation around 9.1% yoy, caused the pair to jump, breaking above the 139.00 figure and reaching a new weekly high of 139.68.
Therefore, the path of least resistance for EUR/JPY is to the upside. Therefore, the first resistance of the EUR/JPY is at 140.00. A decisive break would pave the way for the 21st July cycle high at 142.32.
The EUR/JPY 4-hour chart shows the pair breaking above the July 27 high at 139.50, reinforcing the possibility of a test of 140.00. However, the Relative Strength Index (RSI) is showing signs of exhaustion as EUR/JPY hits a new higher high while the RSI peak is below previous momentum higher. Therefore, a negative divergence could be forming, which means that the EUR/JPY could drop soon before resuming the uptrend.
The first resistance of the EUR/JPY would be the high of 140.07 of July 25. Once broken, the next resistance would be the daily high of 22 July at 141.09, followed by the yearly high at 142.35.
Technical levels
Source: Fx Street
With 6 years of experience, I bring to the table captivating and informative writing in the world news category. My expertise covers a range of industries, including tourism, technology, forex and stocks. From brief social media posts to in-depth articles, I am dedicated to creating compelling content for various platforms.


