
- EUR/JPY pulls back but remains above the 20-day EMA even though the RSI has turned lower.
- In the short term, EUR/JPY could retest the Oct 5 low at 142.44 before resuming its downtrend towards 141.00.
The EUR/JPY continues to fall for the second day in a row as market sentiment has soured, as evidenced by Wall Street ending with losses, while US Federal Reserve policy makers remain hell-bent on crush inflation. At the time of this writing, the EUR/JPY is trading at 142.24, down 0.51%.
EUR/JPY Price Forecast
The daily chart of EUR/JPY shows that the pair is facing solid support at the 20-day EMA around 142.08. Despite Thursday’s daily low of 141.95, sellers were unable to hold strong, so EUR/JPY rallied back to 142.00. Notably, the Relative Strength Index (RSI) just crossed below the 7-day RSI SMA, indicating that sell orders might be starting to pile up in the pair. Unless EUR/JPY records a daily close below 142.00, the pair remains neutral to bullish.
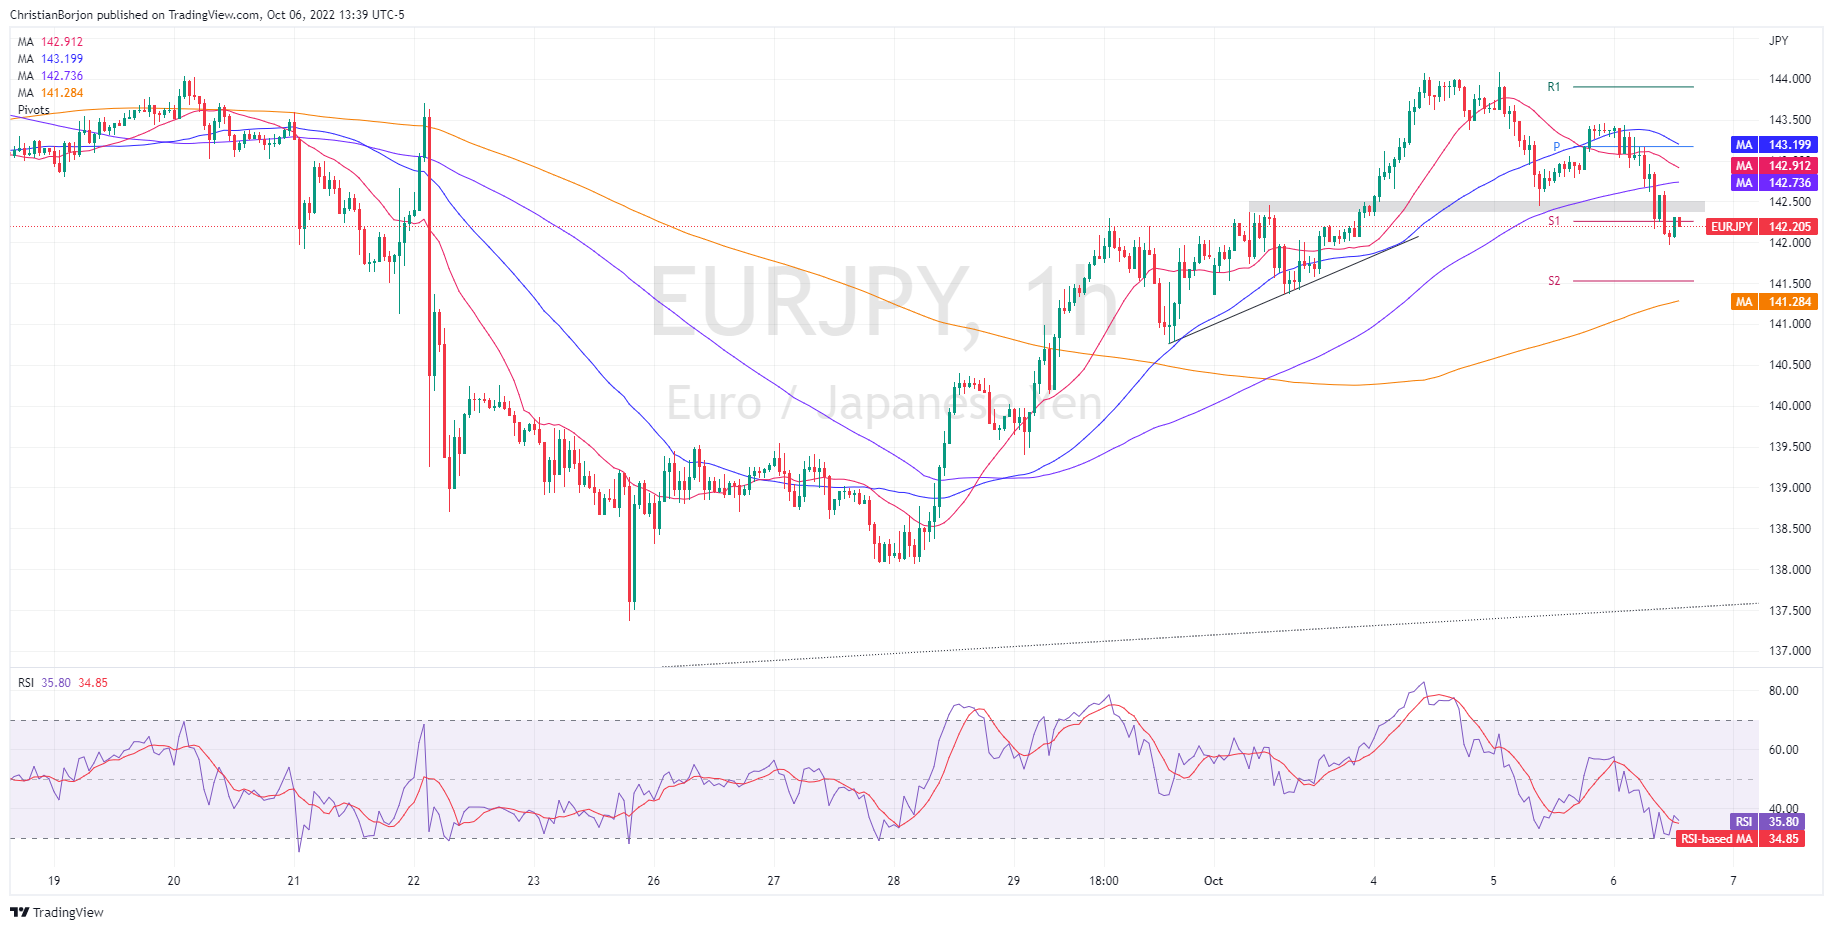
In the short term, EUR/JPY has a neutral to bearish bias, hovering around the daily S1 pivot at 142.28. On Thursday, the pair stumbled below the 50, 20 and 100 EMAs, opening the door for further losses, but the decline was stopped at 142.00.
Although the currency cross has a bearish bias, the Relative Strength Index (RSI) crossed above its 7-RSI SMA, which means that the buyers are gaining some strength. Therefore, it is likely to retest the daily low of Oct 5 at 142.44 before continuing lower.
If this scenario plays out, the first support for the EUR/JPY would be 142.00. A break below will expose the S2 daily pivot at 141.50, ahead of the next demand zone, and the 200 EMA at 141.28, followed by the 141.00 figure.
EUR/JPY hourly chart
EUR/JPY Key Technical Levels
Source: Fx Street
With 6 years of experience, I bring to the table captivating and informative writing in the world news category. My expertise covers a range of industries, including tourism, technology, forex and stocks. From brief social media posts to in-depth articles, I am dedicated to creating compelling content for various platforms.


