
- The EUR/JPY pair ends the week in the negative, down 0.48%, as the yen shows signs of strength.
- The deteriorating market mood increases the appetite for haven assets.
- EUR/JPY Price Analysis: Short-term has a bearish bias, with eyes on a drop below 137.00.
The EUR/JPY slumps from weekly highs hit Thursday at 142.32, down over 160 pips on Friday, towards 138.00 zone, amid muted market mood, which increased appetite for safety, bolstering in FX space , the Japanese yen. At the time of writing, the EUR/JPY is trading at 138.93.
US stocks fell between 0.43% and 1.77% at the close on Wall Street. Social media companies disappointed estimates, and US economic data was lackluster, adding to recession fears. In the currency arena, the USD finished flat on Friday, as the US Dollar Index shows, but fell 1.28%, snapping three straight weeks of gains.
EUR/JPY Price Analysis: Technical Outlook
The EUR/JPY pair continues to have a bullish bias, despite the ongoing pullback from weekly highs at 142.32, towards its lows at 138.89. Traders should note that the cross broke below the 20 and 50 day EMAs, which aggravated the break below 139.00. However, unless EUR/JPY sellers retake the 100-day EMA at 137.06, the uptrend is intact.
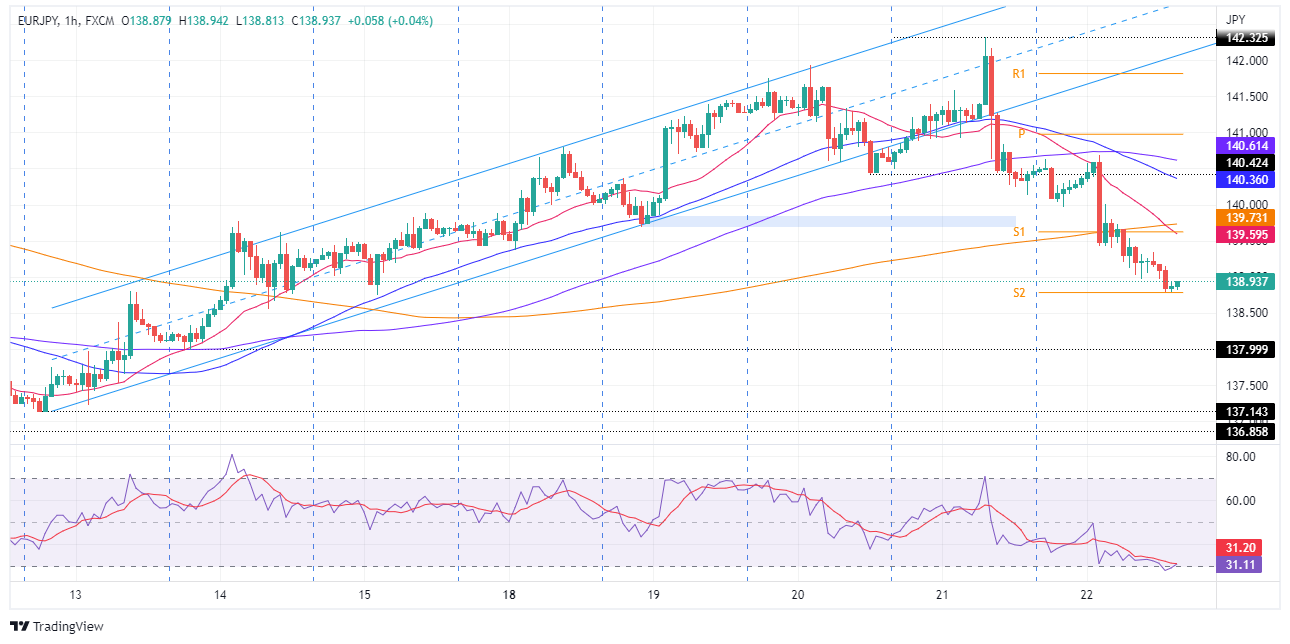
EUR/JPY 1 hour chart
The 1 hour chart of EUR/JPY illustrates that once the pair dipped below the lower trend line of the ascending channel next to the 140.42 low of 20 Jul, the bias would change from neutral to bearish in the short term . However, the sellers outperformed the buyers and the pair sank from the 140.00 area to 138.90, breaking the 200 hourly EMA on the way down.
Therefore, the short-term EUR/JPY has a bearish bias. The first support of the EUR/JPY will be 138.50. If it breaks below, the Jul 13 low at 137.99 will be exposed, followed by the Jul 12 low at 137.14.
EUR/JPY Key Technical Levels
Source: Fx Street
With 6 years of experience, I bring to the table captivating and informative writing in the world news category. My expertise covers a range of industries, including tourism, technology, forex and stocks. From brief social media posts to in-depth articles, I am dedicated to creating compelling content for various platforms.


