- EUR/JPY gains traction near 166.65 in the early stages of the European session on Wednesday.
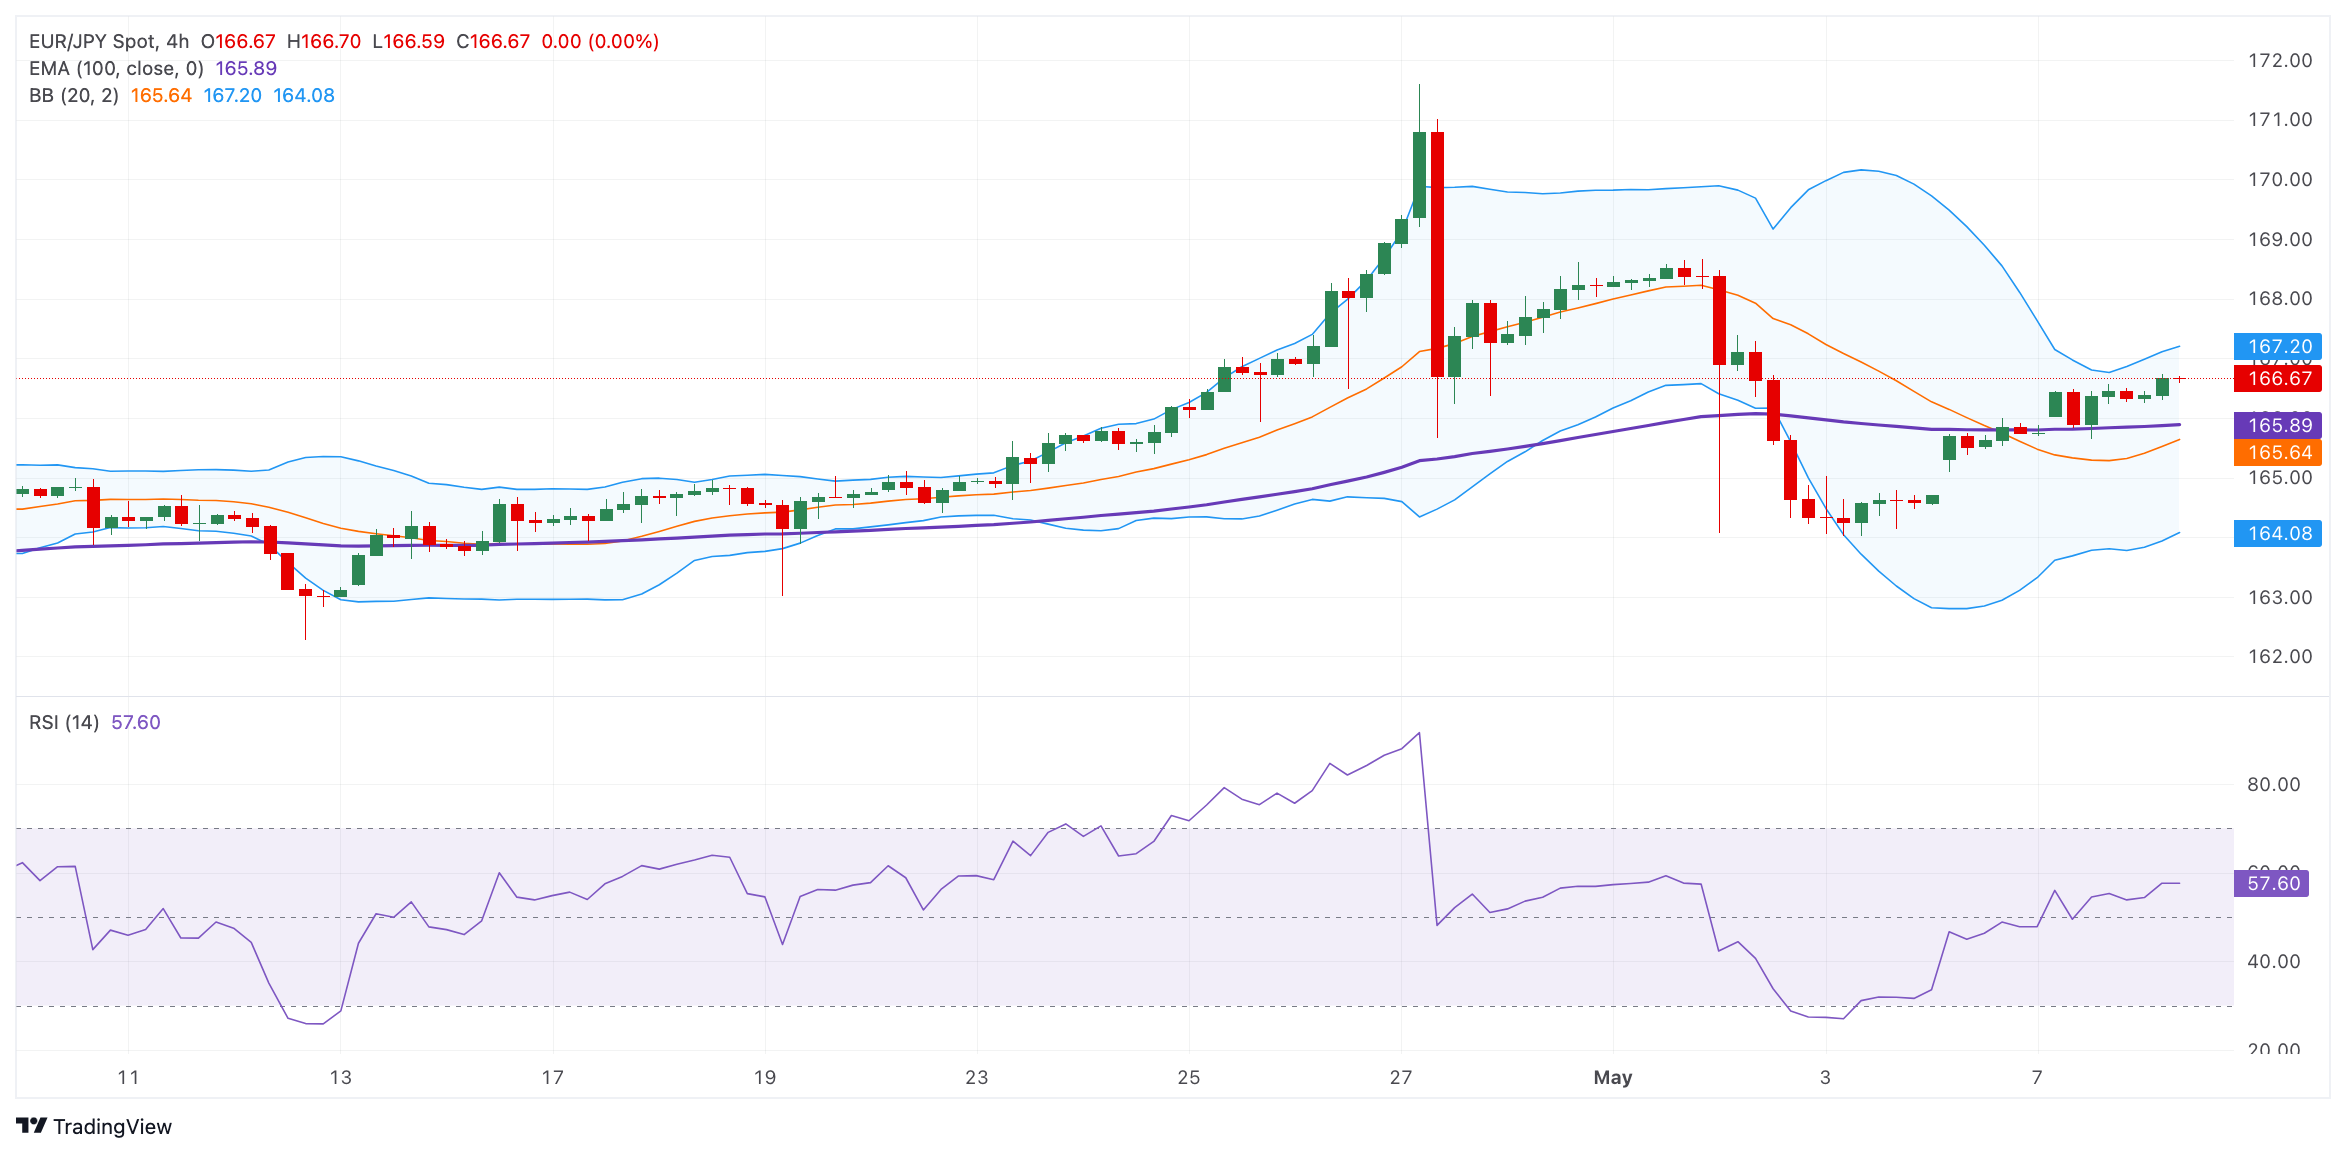
- The cross resumes its uptrend above the key EMA; The RSI indicator remains in bullish territory.
- The first bullish barrier will emerge at 167.20; the initial support level is located at 165.90.
EUR/JPY is trading positive for three consecutive days around 166.65 on Wednesday during the early hours of the European session. Bank of Japan (BoJ) Governor Kazuo Ueda stated on Wednesday that the Japanese central bank could take monetary policy measures if movements in the Yen have a large impact on inflation. For his part, Japanese Finance Minister Shunichi Suzuki stated that rapid currency movements are not desirable. Suzuki declined to comment on whether the US has accepted Japan's intervention in the foreign exchange market.
Technically, EUR/JPY resumes its uptrend as the cross remains above the key 100 EMA on the four-hour chart. Furthermore, the Relative Strength Index (RSI) is in bullish territory around 58, indicating that the continuation of the uptrend seems favorable for the moment.
The upper boundary of the Bollinger band at 167.20 acts as immediate resistance level for the crossover. Further north, the next hurdle lies at the psychological figure of 168.00, on the way to an April 30 high at 168.61. Buying above this last level will lead to a rally to the 2007 yearly high of 168.95.
On the downside, the initial support level for EUR/JPY lies near the 100 EMA at 165.90. A decisive break below this level will lead to an upside. A decisive break below this level will result in a drop to the May 6 low at 165.50, followed by the Bollinger Bands lower boundary at 164.08.
EUR/JPY Four-hour chart

EUR/JPY
| Panorama | |
|---|---|
| Today's Latest Price | 166.84 |
| Today's Daily Change | 0.47 |
| Today's Daily Change % | 0.28 |
| Today's Daily Opening | 166.37 |
| Trends | |
|---|---|
| 20 Daily SMA | 165.54 |
| SMA of 50 Daily | 164.09 |
| SMA of 100 Daily | 161.89 |
| SMA of 200 Daily | 160.32 |
| Levels | |
|---|---|
| Previous Daily High | 166.57 |
| Previous Daily Low | 165.64 |
| Previous Weekly High | 171.6 |
| Previous Weekly Low | 164.02 |
| Previous Monthly High | 171.6 |
| Previous Monthly Low | 162.28 |
| Daily Fibonacci 38.2% | 166.22 |
| Daily Fibonacci 61.8% | 166 |
| Daily Pivot Point S1 | 165.82 |
| Daily Pivot Point S2 | 165.26 |
| Daily Pivot Point S3 | 164.89 |
| Daily Pivot Point R1 | 166.75 |
| Daily Pivot Point R2 | 167.12 |
| Daily Pivot Point R3 | 167.68 |
Source: Fx Street
I am Joshua Winder, a senior-level journalist and editor at World Stock Market. I specialize in covering news related to the stock market and economic trends. With more than 8 years of experience in this field, I have become an expert in financial reporting.


