
- EUR/JPY adds to Tuesday’s pullback below 143.00.
- The 138.00 area should offer good short-term support.
EUR/JPY extends downward correction for the second consecutive session and tests the 143.00 zone on Wednesday.
It is not surprising that there is a 180 degree turn considering the bearish divergence on the daily RSI. That said, the continuation of the decline could extend to the 138.80 area, where the 55 and 100 SMAs coincide.
Meanwhile, should the cross continue above the 200 SMA at 135.08, the outlook for the cross should remain constructive.
EUR/JPY day chart
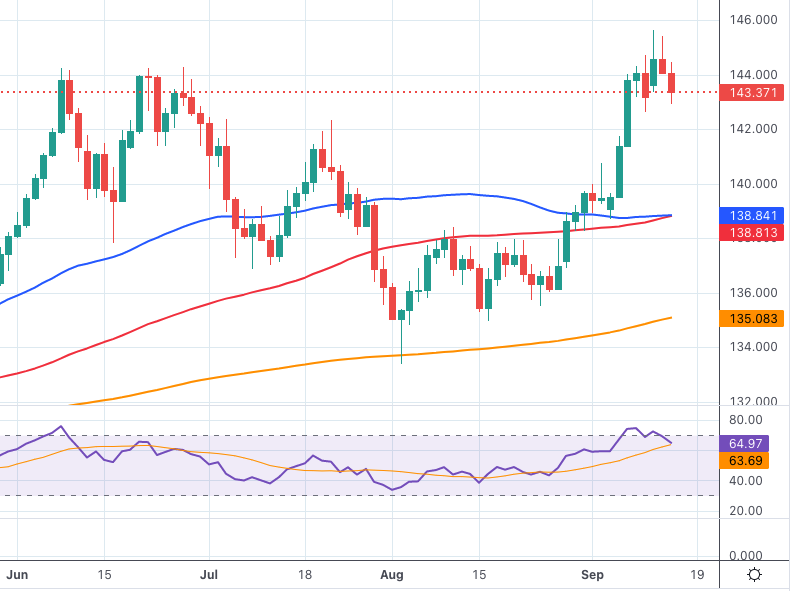
Source: Fx Street
With 6 years of experience, I bring to the table captivating and informative writing in the world news category. My expertise covers a range of industries, including tourism, technology, forex and stocks. From brief social media posts to in-depth articles, I am dedicated to creating compelling content for various platforms.


