
- EUR/JPY accelerates decline below 138.00 on Thursday.
- Immediately to the downside now comes the July low at 136.85.
EUR/JPY quickly pulls back to 2-week lows well below 138.00 on Thursday.
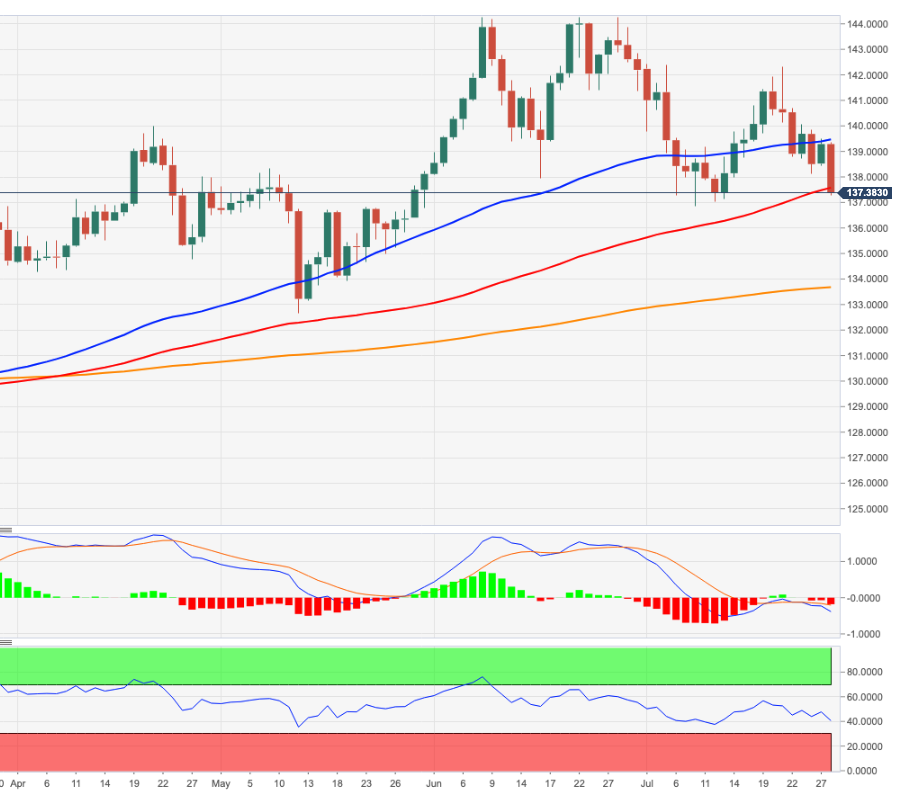
The cross remains under pressure and is vulnerable to further decline while below the weekly high of 142.32 (July 21). Against this, the next support to watch lines up at the July low at 136.85 (July 8). If it breaks sustainably, the cross could attempt a move towards the critical 200 SMA today at 133.65.
In the long term, the constructive stance on the cross remains well supported by the 200-day simple moving average at 133.65.
EUR/JPY day chart
Source: Fx Street
With 6 years of experience, I bring to the table captivating and informative writing in the world news category. My expertise covers a range of industries, including tourism, technology, forex and stocks. From brief social media posts to in-depth articles, I am dedicated to creating compelling content for various platforms.


")


