
- EUR/JPY adds to Monday’s pullback and touches 143.00 again.
- If it continues to drop, it could revisit the 142.00 area in the short term.
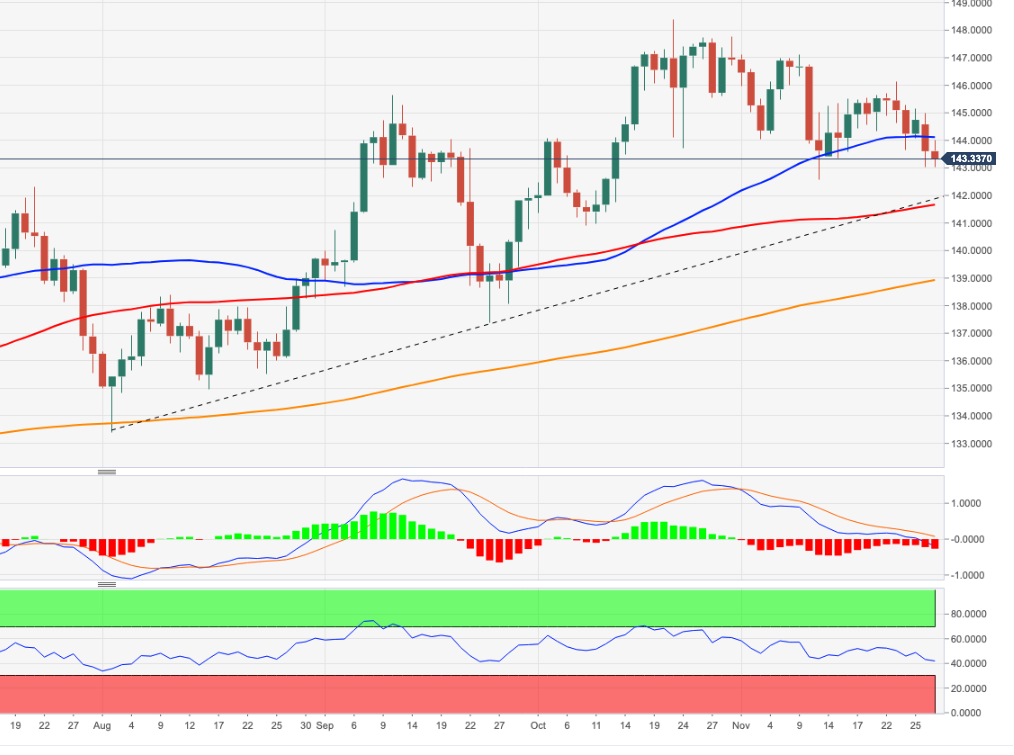
The USD/JPY extends the pessimism from earlier in the week and tests the 143.00 area on Tuesday.
Should selling pressure gain more strength, the cross could attempt a move towards the November low at 142.54 (Nov 11) ahead of the temporary 100-day SMA at 141.62 today.
Longer-term, as long as it is above the key 200-day SMA at 138.89, the positive outlook is expected to hold.
EUR/JPY daily chart
Source: Fx Street
I am Joshua Winder, a senior-level journalist and editor at World Stock Market. I specialize in covering news related to the stock market and economic trends. With more than 8 years of experience in this field, I have become an expert in financial reporting.


