
- EUR/JPY is trading inside an unfinished range on Monday.
- The 139.85 zone limits the upside for now.
EUR/JPY alternates gains with losses in the 138.00 zone at the beginning of the week.
Meanwhile, the cross remains under pressure amid the ongoing bounce from July lows in the 136.80 region (8 Jul). If it continues to trade below the four-month resistance line near 139.85, further losses should remain on the cards.
That said, further downside could lead to a visit to the 100 SMA at 136.09 before minor support at 133.92 (low May 19).
In the long term, the constructive stance on the cross remains well supported by the 200 SMA at 133.12.
EUR/JPY day chart
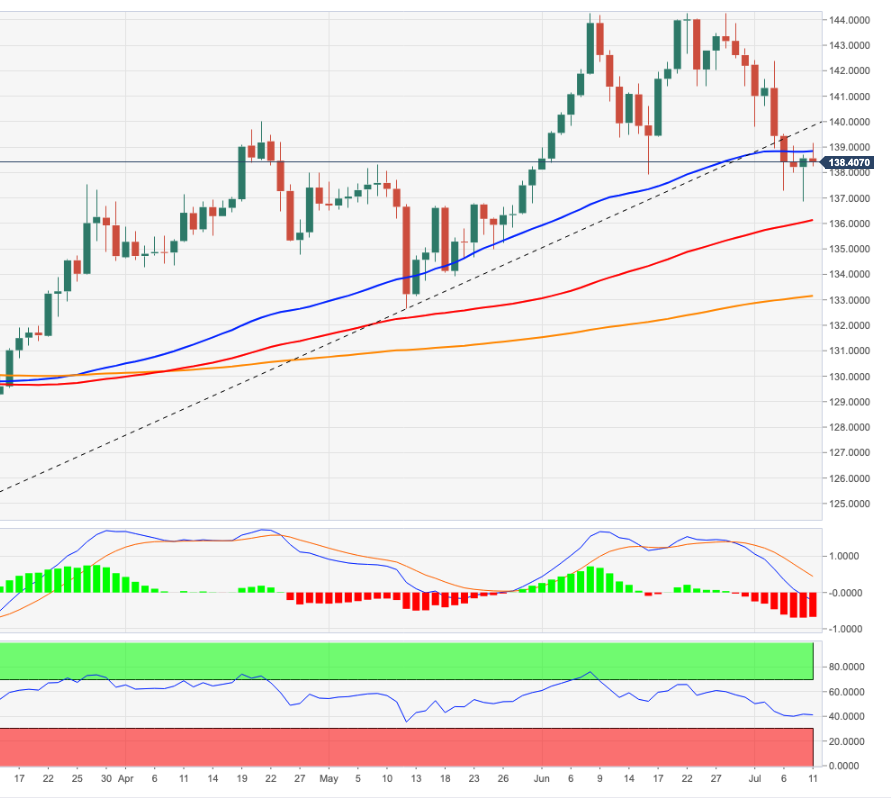
Source: Fx Street
With 6 years of experience, I bring to the table captivating and informative writing in the world news category. My expertise covers a range of industries, including tourism, technology, forex and stocks. From brief social media posts to in-depth articles, I am dedicated to creating compelling content for various platforms.


