
- EUR/JPY corrects lower after briefly breaking above 144.00.
- Further rallies are expected to challenge the high of recent years beyond 145.00.
EUR/JPY is under pressure after five consecutive daily gains on Wednesday, including a test of the key resistance zone around 144.00.
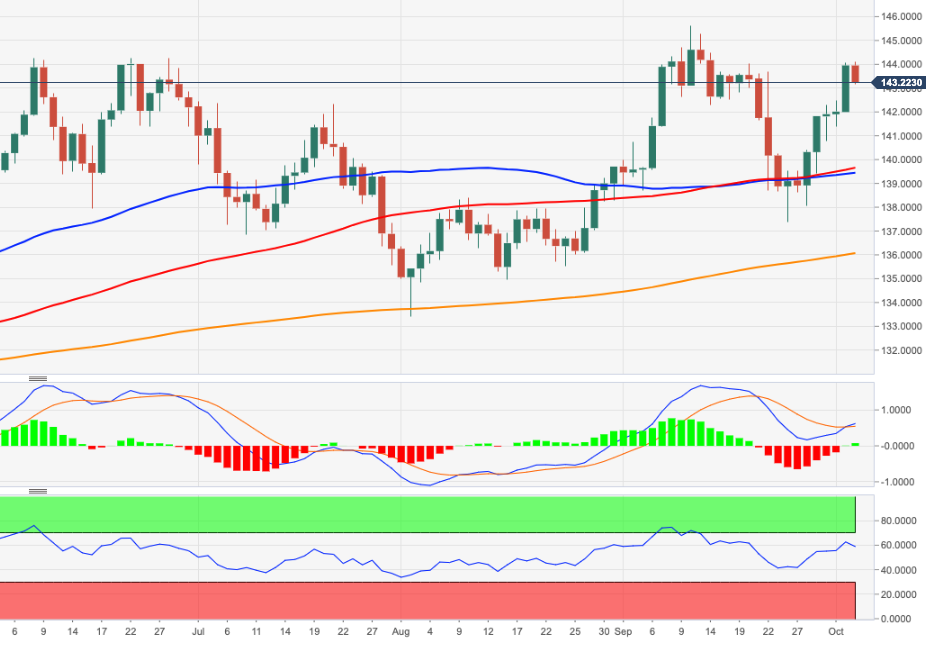
The continuation of the bounce from last week’s lows remains good for now. That said, if the cross extends the break of the weekly high at 144.04 (Sep 20), it could then challenge the 2022 high at 145.63 (Sep 12).
Meanwhile, should it continue above the key 200 SMA at 136.04, the constructive outlook for the cross should remain unchanged.
EUR/JPY day chart
Source: Fx Street
With 6 years of experience, I bring to the table captivating and informative writing in the world news category. My expertise covers a range of industries, including tourism, technology, forex and stocks. From brief social media posts to in-depth articles, I am dedicated to creating compelling content for various platforms.
")


