
- EUR/JPY rises again after Thursday’s pullback.
- The next target on the upside is the August high at 138.40.
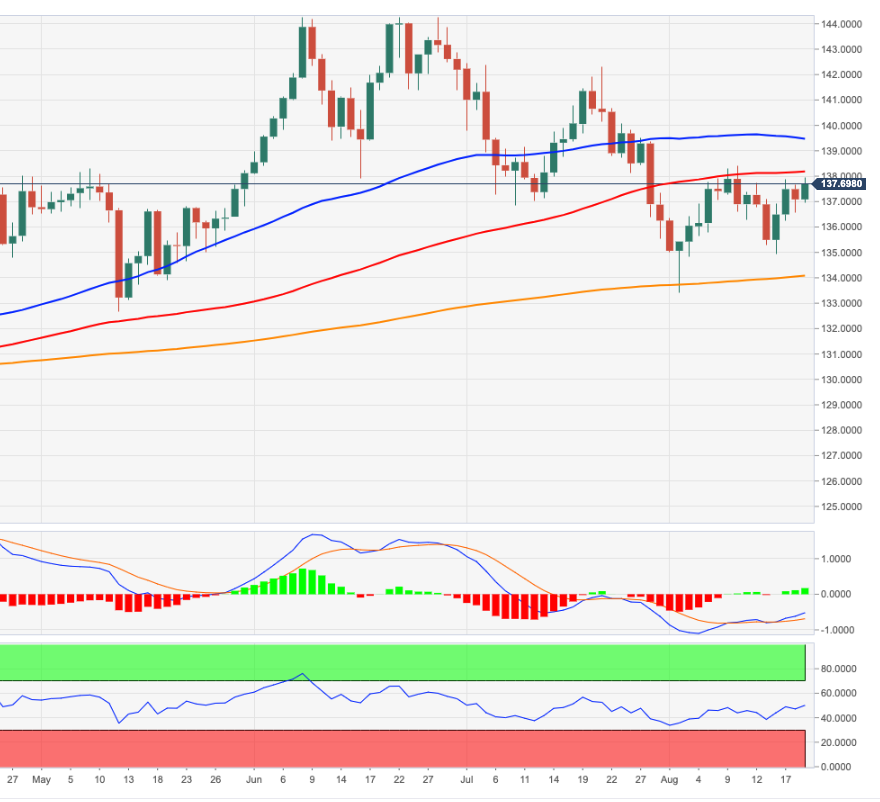
EUR/JPY continues the weekly rally and is already flirting with the 138.00 zone on Friday.
If the cross breaks above the August high at 138.39 (Aug 10), gains should accelerate further and revisit the 55-day simple moving average time barrier today at 139.44.
As long as it is above the 200-day moving average at 134.05, the outlook for the pair should remain constructive.
EUR/JPY day chart
Source: Fx Street
With 6 years of experience, I bring to the table captivating and informative writing in the world news category. My expertise covers a range of industries, including tourism, technology, forex and stocks. From brief social media posts to in-depth articles, I am dedicated to creating compelling content for various platforms.


