
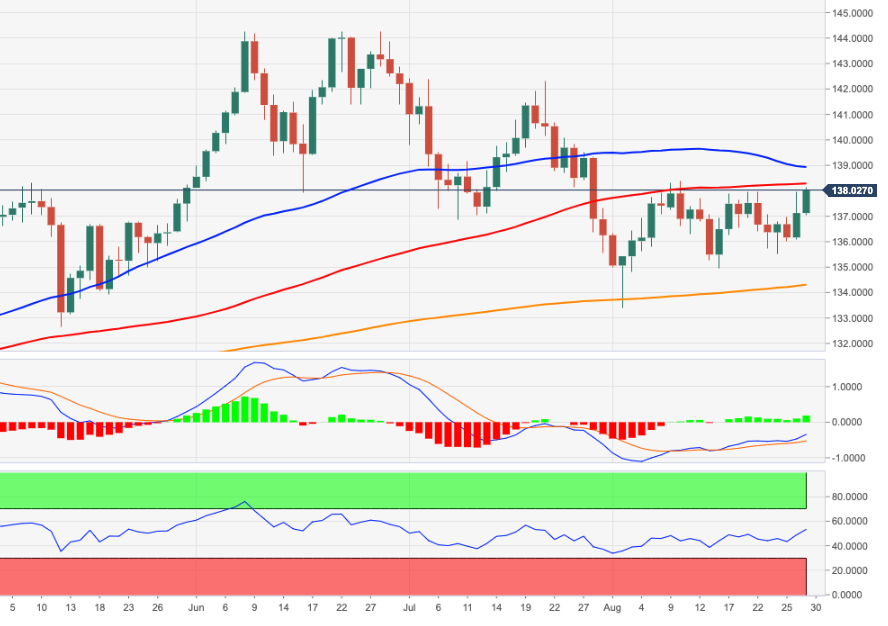
- The EUR/JPY continues to give wings to the ongoing rebound and returns to 138.00.
- If it continues to rise, the pair could retest the 55-day SMA near 138.90.
The EUR/JPY extends recent gains and recovers the area above the 138.00 area earlier in the week.
The continuation of the uptrend has an initial target of the August high at 138.39 (Aug 10) before hitting the temporary 55-day SMA today 138.89. Breaking above this level should shift attention to the weekly high at 142.32 (July 21).
As long as it is above the 200-day SMA at 134.27, the outlook for the pair should remain constructive.
EUR/JPY daily chart
Source: Fx Street
With 6 years of experience, I bring to the table captivating and informative writing in the world news category. My expertise covers a range of industries, including tourism, technology, forex and stocks. From brief social media posts to in-depth articles, I am dedicated to creating compelling content for various platforms.


