
- EUR/JPY attempts a slight rebound after Wednesday’s drop.
- The August high at 138.39 caps the upside for now.
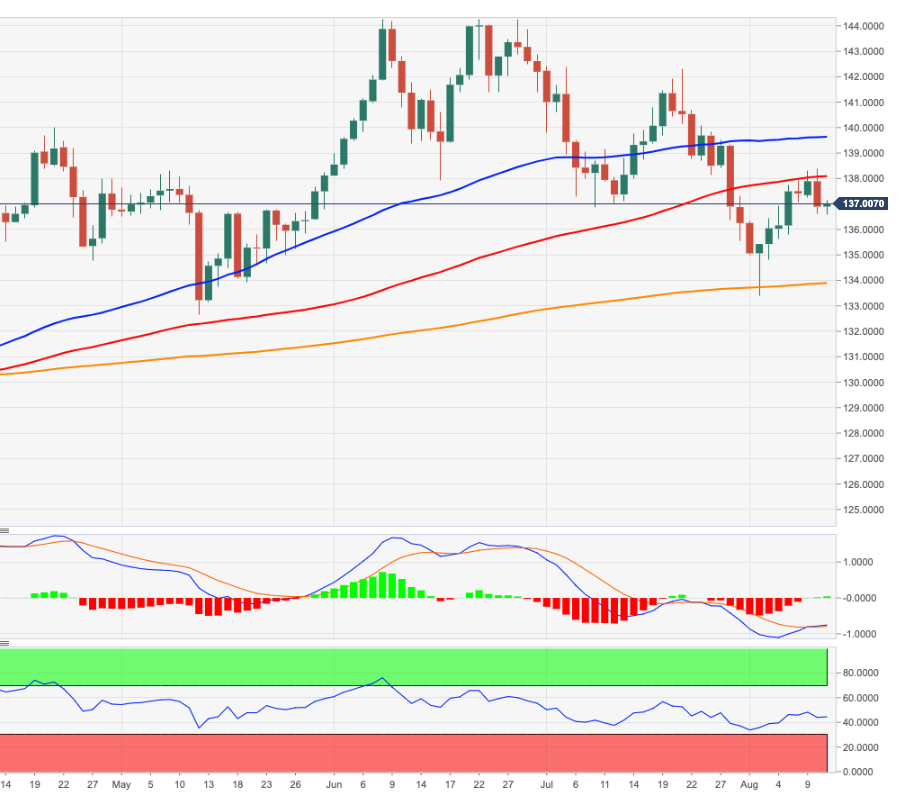
EUR/JPY rebounds from weekly lows in the 136-60/50 band and recovers some ground lost in Wednesday’s sharp pullback.
For now, the August recovery seems to have met some initial resistance at the 138.40 area (Aug 10). If the cross regains upside traction and breaks above this level, it could extend the move to initially the 55-day simple moving average today at 139.06.
As long as it is above the 200 SMA at 133.87, the outlook for the cross is expected to remain constructive. This zone of contention also appears to be underpinned by the approach of the August low at 133.39 (Aug 2).
EUR/JPY day chart
Source: Fx Street
With 6 years of experience, I bring to the table captivating and informative writing in the world news category. My expertise covers a range of industries, including tourism, technology, forex and stocks. From brief social media posts to in-depth articles, I am dedicated to creating compelling content for various platforms.


%20Luca%20Delpia%20-%20Archivio%20della%20Fondazione%20I%20Teatri%20Reggio%20Emilia%201071%20b%20(002).jpg "The CCCP on stage in Legnano for the last call: “If you weren’t there, we would not be here”")


