
- EUR/JPY attracts some buyers near 169.30 in the European session on Wednesday, up 0.50% on the day.
- The cross maintains the negative picture unchanged below the 100 EMA, with the RSI bearish on the 4-hour chart.
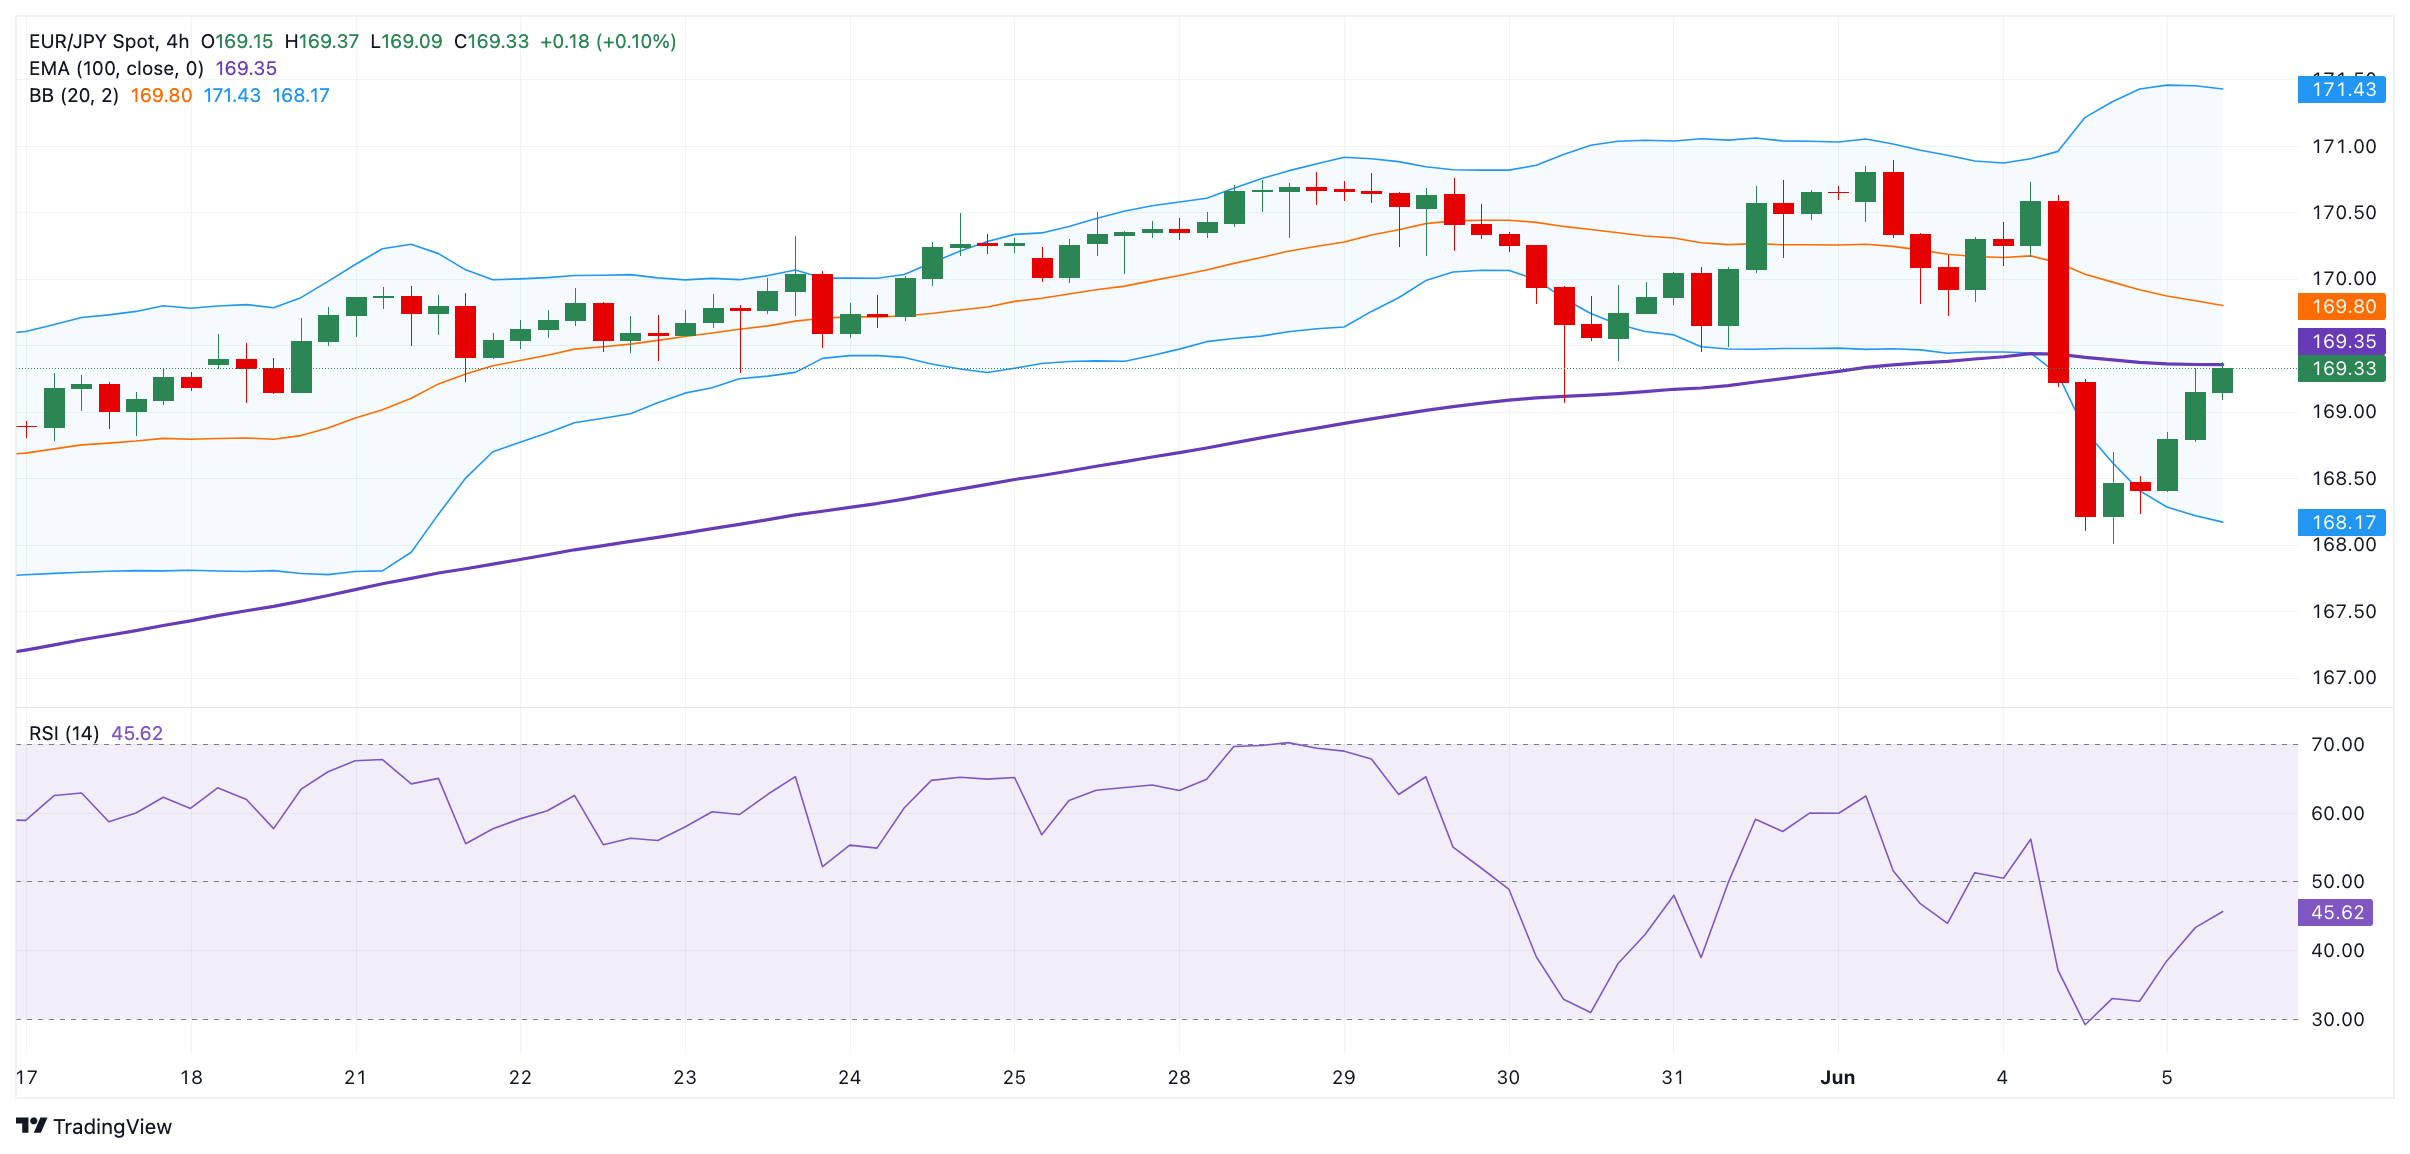
- The key barrier to the upside appears at the psychological level of 170.00; the initial support level is located at 168.15.
EUR/JPY breaks two-day losing streak around 169.30 during the European session on Wednesday. Traders are closely watching the European Central Bank's (ECB) interest rate decision on Thursday, which is likely to reduce interest rates by 25 basis points (bps).
Technically, EUR/JPY maintains the bearish outlook as the cross remains below the 100 EMA on the four-hour chart. The bearish momentum is supported by the Relative Strength Index (RSI), which is in the bearish zone near 44.00, indicating that the path of least resistance is to the downside.
The cross could resume the rise if it manages to break above the 100 EMA at 169.35. Further north, the crucial hurdle is seen at the psychological mark of 170.00. Any follow-on buying will see a rally to a June 4 high at 170.72 en route to the Bollinger Band upper boundary at 171.43.
On the other hand, the initial support level is near the lower boundary of the Bollinger Band at 168.15. A break of the mentioned level could expose a May 16 low at 167.33. The additional downside filter to watch is a May 7 low at 165.64.
EUR/JPY 4-hour chart
Source: Fx Street
I am Joshua Winder, a senior-level journalist and editor at World Stock Market. I specialize in covering news related to the stock market and economic trends. With more than 8 years of experience in this field, I have become an expert in financial reporting.


.jpg "Summer in your eyes: is Conrad Fisher the Leonardo DiCaprio della Gen Z?")
