
- EUR/JPY falls to 162.75 on fears of Bank of Japan intervention.
- The crossover maintains the negative outlook below the key EMA; The RSI indicator is in bearish territory.
- The first bullish barrier will emerge at 163.15; The first bearish objective is located at 162.65.
EUR/JPY loses momentum near 162.75 during early European trading hours on Tuesday. Growing speculation that the Bank of Japan (BoJ) will intervene in the currency market could support the Japanese Yen (JPY) in the short term. Early Tuesday, Japanese Finance Minister Shunichi Suzuki stated that he will not rule out any measures to respond to disorderly movements and that he will monitor movements in the currency market with a high sense of urgency.
From a technical point of view, the bearish trend of EUR/JPY remains intact as the pair is below the 50 and 100 period exponential moving averages (EMA) on the four-hour chart. The Relative Strength Index (RSI) is in bearish territory around 36.40, supporting the sellers for the moment.
The first bullish barrier for EUR/JPY will emerge near the 100 EMA at 163.15. Further north, the next target is the 50 EMA at 163.32. A decisive break above the latter will expose the upper boundary of the Bollinger Bands at 163.58. A buy above this level would maintain the bullish move to the March 27 high at 164.41.
On the other hand, the lower boundary of the Bollinger Bands at 162.65 acts as an initial support level for the crossover. The key containment level sits at 162.00, which represents a March 19 low and a psychological level. A break below 162.00 would cause a drop to the March 14 low of 161.10.
EUR/JPY four-hour chart
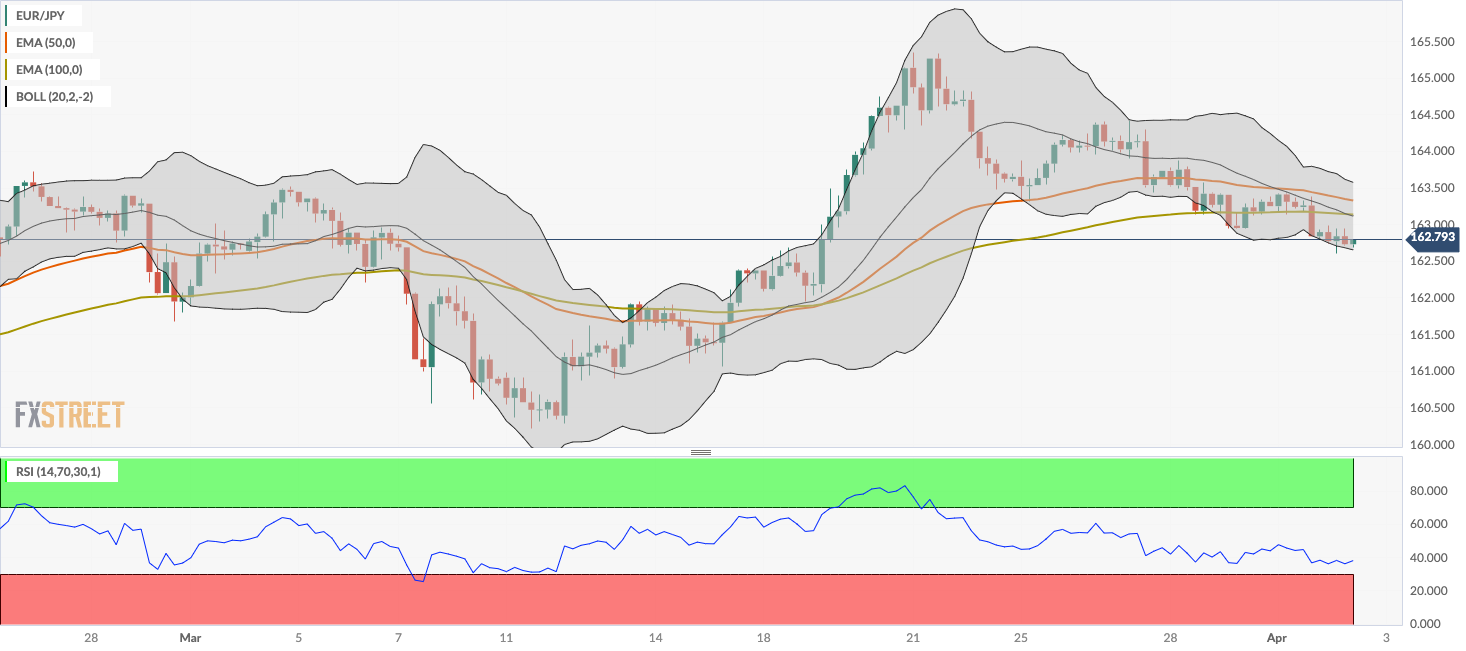
Source: Fx Street
I am Joshua Winder, a senior-level journalist and editor at World Stock Market. I specialize in covering news related to the stock market and economic trends. With more than 8 years of experience in this field, I have become an expert in financial reporting.


