
- The daily RSI has changed course upwards, supported by the flat red bars on the MACD.
- Buyers stepped in to reclaim the 20-day SMA, changing the short-term outlook from bearish to neutral.
- The underlying uptrend remains protected by the 100-day and 200-day SMAs.
In the Wednesday session, the EUR/JPY pair saw a change in momentum as buyers stepped in to reclaim the 20-day SMA at 169.40, supported by a recovery in the Yen against its peers. This bullish shift counters the bearish momentum from Tuesday’s session, as the pair emerges from local lows of 168.50.
The RSI on the daily chart has shown an upward shift from 48 to 54. This suggests an increase in buying momentum, which could pave the way for a more substantial bullish move. The flat red bars on the daily MACD indicator further support this improving outlook.
EUR/JPY Daily Chart
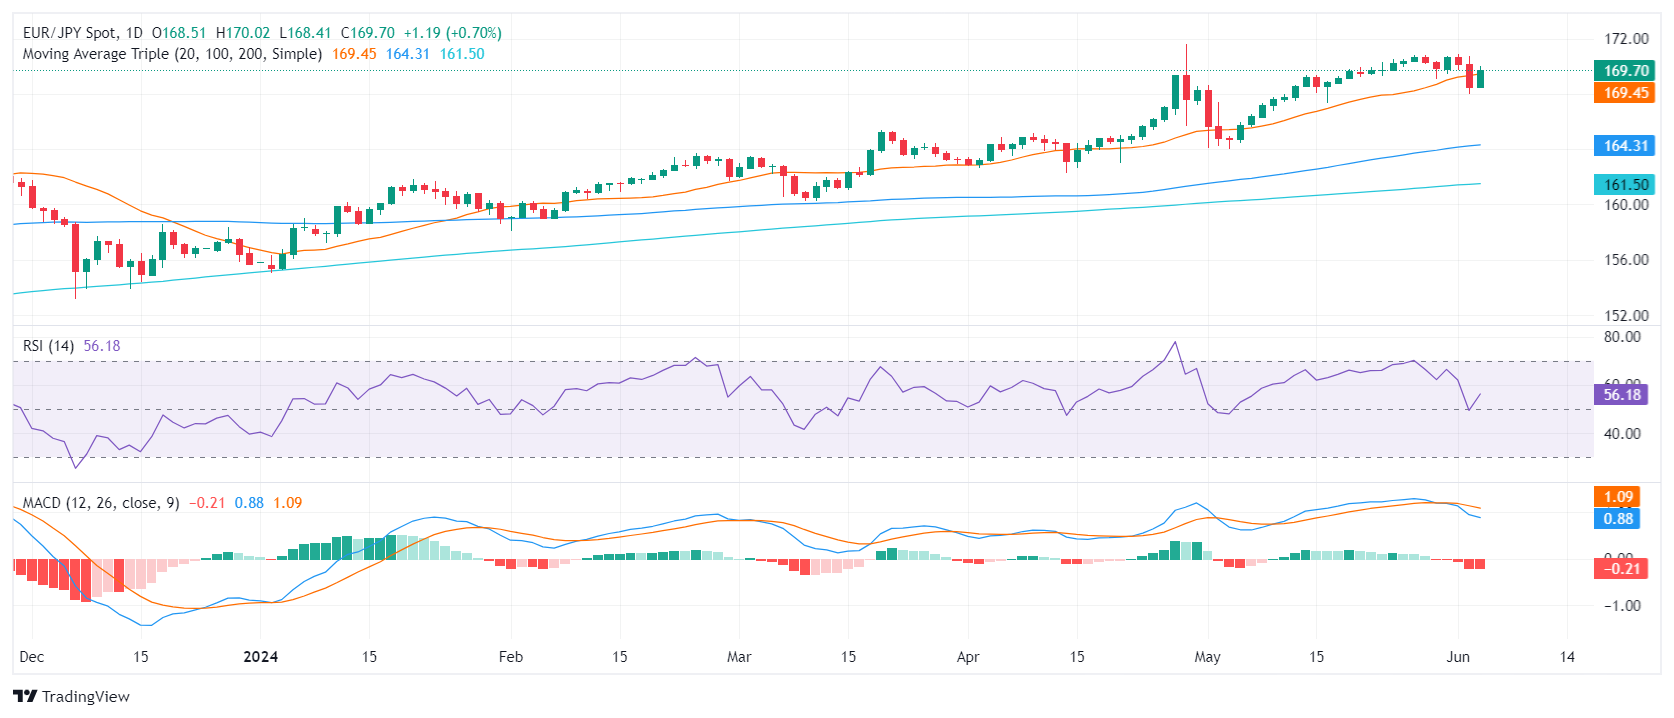
Despite short-term bearish overtones, the overall uptrend remains intact. Support offered by the 100-day and 200-day simple moving averages (SMAs) at 164.00 and 161.00, respectively, still serves as a barrier to any prolonged move lower. Although sellers have gained significant ground in previous sessions, these moves could be corrective rather than reversing the trend.
Although the cross managed to regain ground, the outlook could quickly turn bearish again if the cross fails to hold the recently gained resistance level of 169.40. For the bulls to maintain momentum, a break above this level is necessary, which would allow the pair to target the next key level of 170.00.
Source: Fx Street
I am Joshua Winder, a senior-level journalist and editor at World Stock Market. I specialize in covering news related to the stock market and economic trends. With more than 8 years of experience in this field, I have become an expert in financial reporting.


