
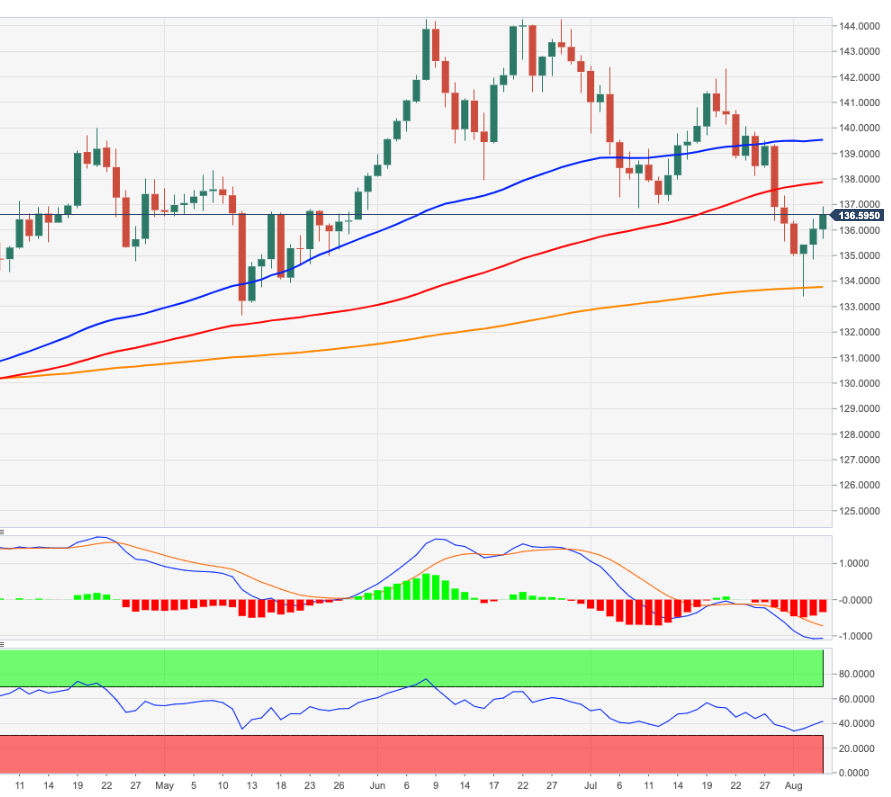
- EUR/JPY extends weekly recovery to the vicinity of 137.00.
- The next upside barrier is at the 100-day moving average near 137.80.
EUR/JPY advances for the third session in a row and flirts with the 137.00 zone on Thursday.
Considering the ongoing price action, the cross looks likely to continue higher for now, with intermediate hurdles at the 100 and 55-day simple moving averages at 137.84 and 139.49, respectively.
As long as it is above the 200 SMA at 133.73, the outlook for the cross is expected to remain constructive.
EUR/JPY day chart
Source: Fx Street
With 6 years of experience, I bring to the table captivating and informative writing in the world news category. My expertise covers a range of industries, including tourism, technology, forex and stocks. From brief social media posts to in-depth articles, I am dedicated to creating compelling content for various platforms.


