
- EUR/JPY adds to Thursday’s bounce and approaches 138.00.
- Further gains seem likely if it closes above the 138.40 area.
The EUR/JPY it bounces further in the second half of the week and looks to retake the 138.00 barrier and higher in the short term.
The continuation of the bullish momentum is expected to find a temporary hurdle at the 100-day SMA at 138.09 before the August high at 138.39 (10 Aug). Breaking above this level should allow for further gains until the 55-day SMA at 139.63 initially.
As long as it is above the 200-day SMA at 133.90, the outlook for the cross is expected to remain constructive. This zone of contention also appears to be underpinned by the approach of the August low at 133.39 (Aug 2).
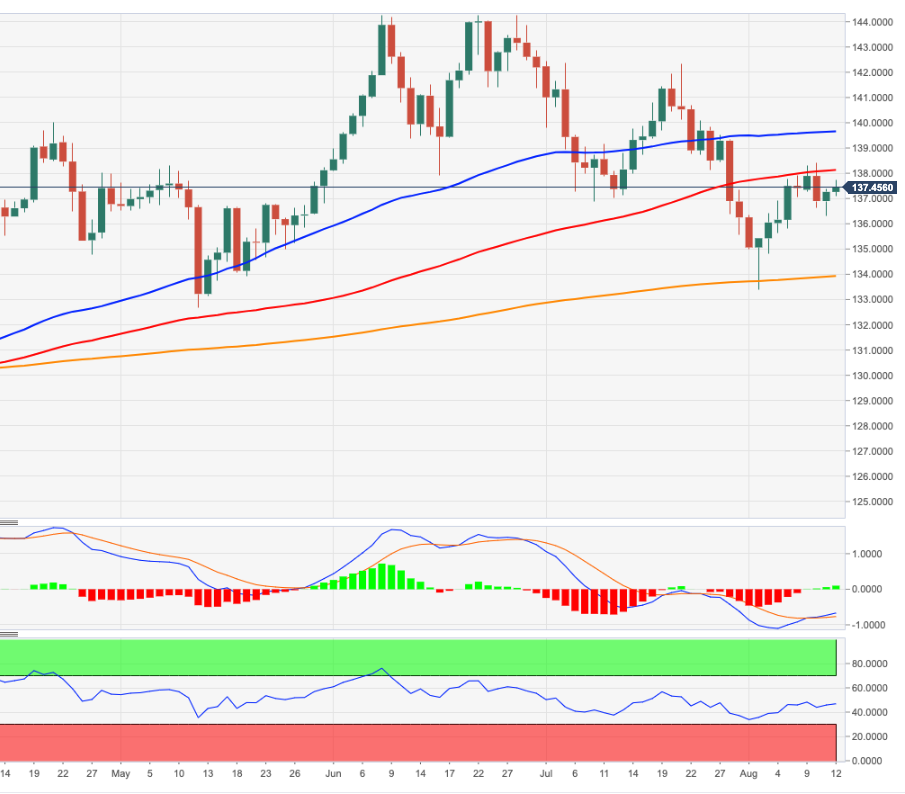
EUR/JPY daily chart
Technical levels
Source: Fx Street
With 6 years of experience, I bring to the table captivating and informative writing in the world news category. My expertise covers a range of industries, including tourism, technology, forex and stocks. From brief social media posts to in-depth articles, I am dedicated to creating compelling content for various platforms.


