
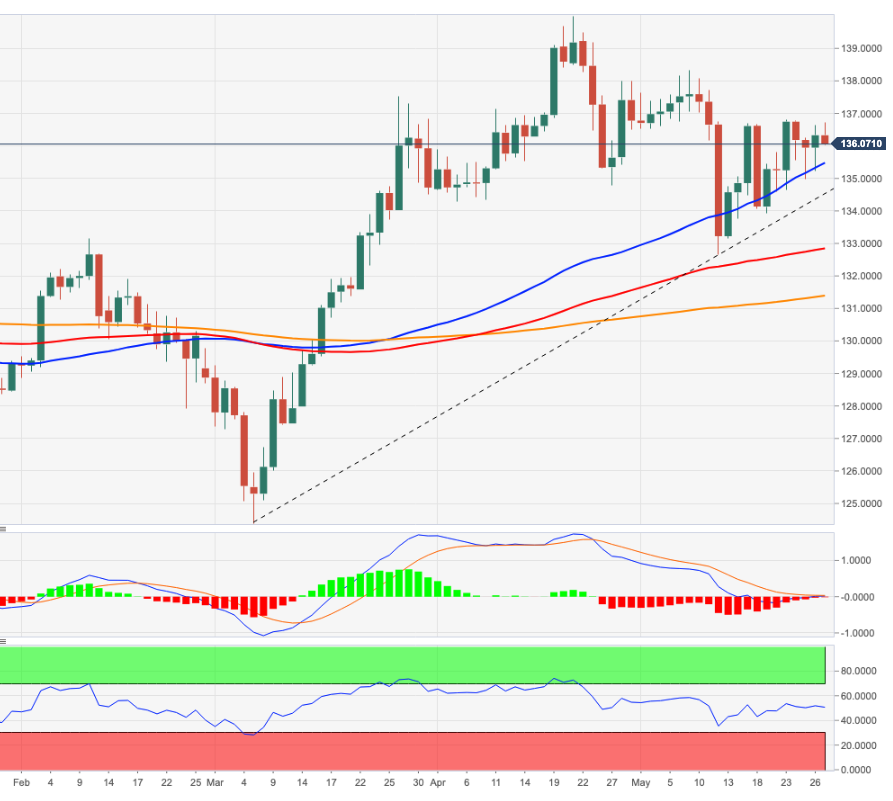
- EUR/JPY is once again teetering around the 136.70 region.
- Further gains above the 134.50 area seem likely.
EUR/JPY corrects lower after once again failing to extend the recovery above the 136.70 area on Friday.
The succession of higher lows since mid-May leaves the prospect of further hikes on the table for now. That said, as long as it remains above the 2-month support line near 134.50, more upside seems likely with the next target being recent peaks in the 136.80 region ahead of the May high of 138.31 (May 9). .
Meanwhile, if it remains above the 200 SMA at 131.36, the outlook for the cross is expected to remain constructive.
EUR/JPY day chart
Source: Fx Street
With 6 years of experience, I bring to the table captivating and informative writing in the world news category. My expertise covers a range of industries, including tourism, technology, forex and stocks. From brief social media posts to in-depth articles, I am dedicated to creating compelling content for various platforms.


