
- EUR/JPY alternates gains with losses below 136.00.
- Further consolidation is likely in the near term.
EUR/JPY is trading volatile after rising as high as the 136.50 region earlier this Thursday.
More sideways trade appears on the table for the cross on the short-term horizon, while further rallies could accelerate following a break above recent highs in the 136.80 region. Beyond the latter, the next major target comes at the May high of 138.31 (May 9).
Meanwhile, if it remains above the 200-day SMA at 131.32, the outlook for the cross is expected to remain constructive.
EUR/JPY day chart
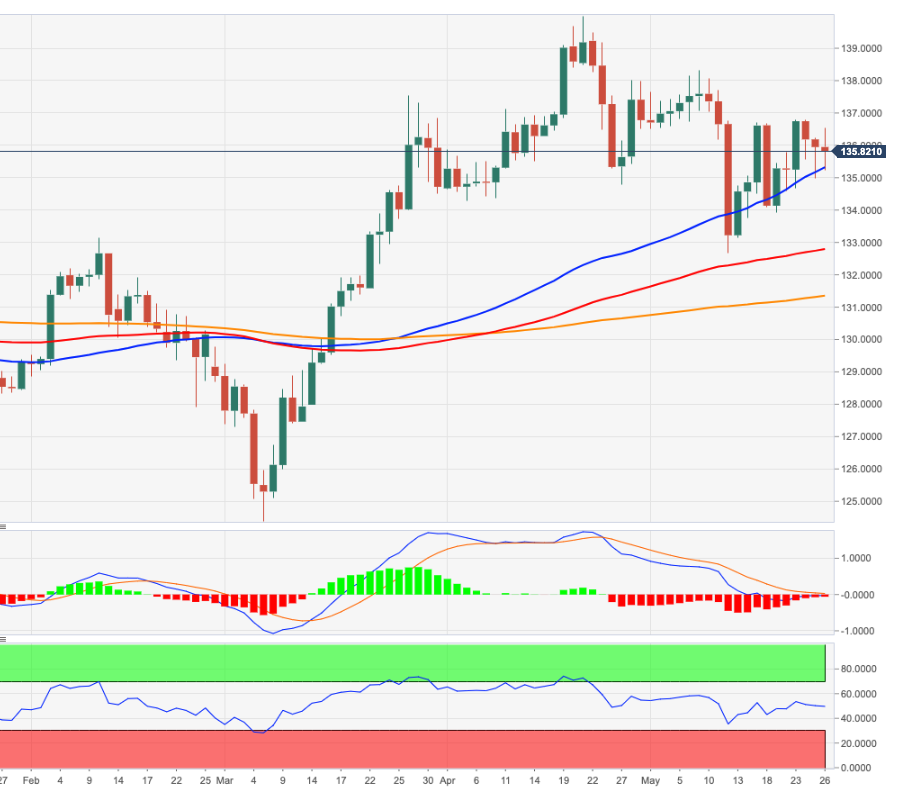
Source: Fx Street
With 6 years of experience, I bring to the table captivating and informative writing in the world news category. My expertise covers a range of industries, including tourism, technology, forex and stocks. From brief social media posts to in-depth articles, I am dedicated to creating compelling content for various platforms.


