
- EUR/JPY further extends consolidation around 141.00.
- The 200-day average keeps downsides capped for now.
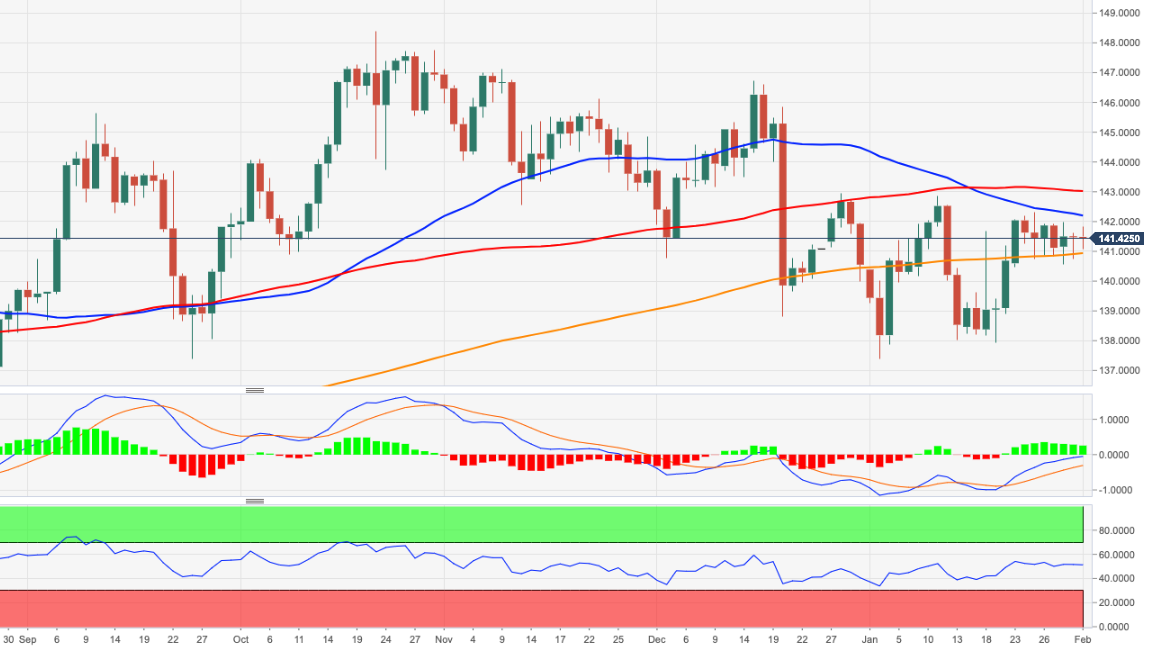
The EUR/JPY maintains the sideways tone around the 141.00 zone, for a new session.
Further consolidation in the near term should not be ruled out. Should the decline accelerate, the next support to watch is the 200-day SMA at 140.90 today. A sustainable drop below the latter would expose the cross to further weakness to initially 138.00. To the upside, a break of the weekly high at 142.29 (Jan 25) could open the door for a possible test of the key resistance zone around 143.00.
The constructive outlook for the EUR/JPY looks unchanged from continuing above the 200-day SMA.
EUR/JPY day chart
Source: Fx Street
I am Joshua Winder, a senior-level journalist and editor at World Stock Market. I specialize in covering news related to the stock market and economic trends. With more than 8 years of experience in this field, I have become an expert in financial reporting.


