
- EUR/JPY extends gains above 137.00.
- Immediately on the upside is the August high at 138.40.
EUR/JPY extends Tuesday’s gains and recovers the 137.00 zone and beyond on Wednesday.
Should the recovery turn more serious, then the cross should meet the next barrier at the 100-day simple moving average at 138.10, before the more relevant August high at 138.39 (Aug 10).
As long as it is above the 200 SMA today at 133.98, the outlook for the pair should remain constructive.
EUR/JPY day chart
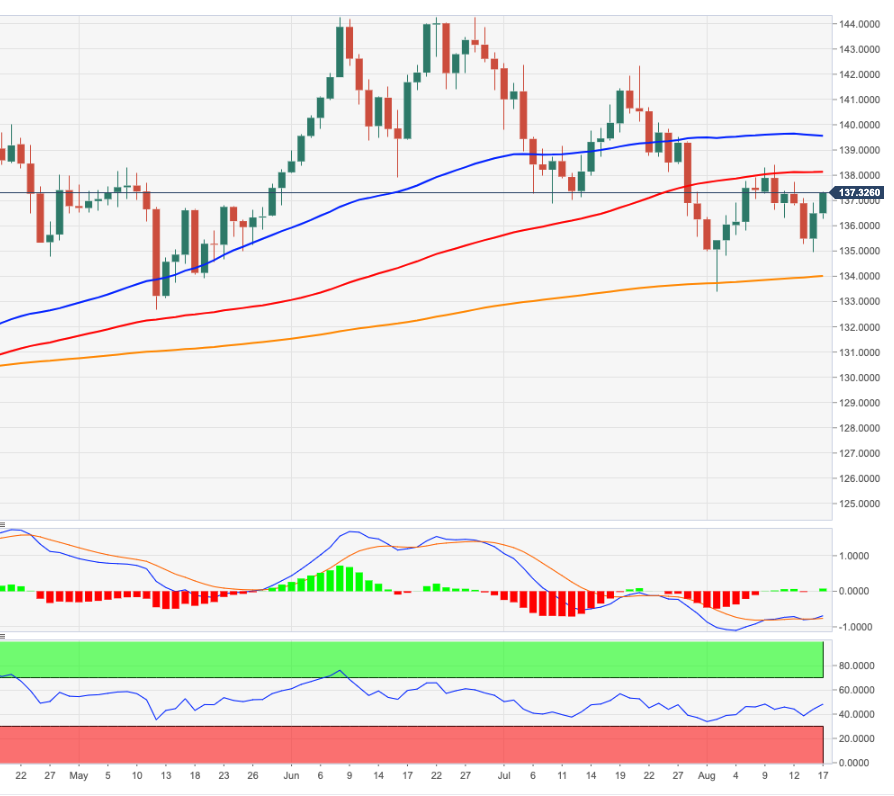
Source: Fx Street
With 6 years of experience, I bring to the table captivating and informative writing in the world news category. My expertise covers a range of industries, including tourism, technology, forex and stocks. From brief social media posts to in-depth articles, I am dedicated to creating compelling content for various platforms.


