
- EUR/JPY continues to fall and challenges the key 200-day moving average.
- Below the latter, the cross could risk a deeper pullback.
EUR/JPY extends bearish move below 134.00 on Tuesday.
Meanwhile, price action on the cross remains entrenched in negative territory, losing ground for the fourth session in a row so far.
A break below the 200-day simple moving average, today at 133.69, could accelerate losses and turn the outlook to negative.
Immediately to the downside is the May low at 132.65 (May 12).
EUR/JPY day chart
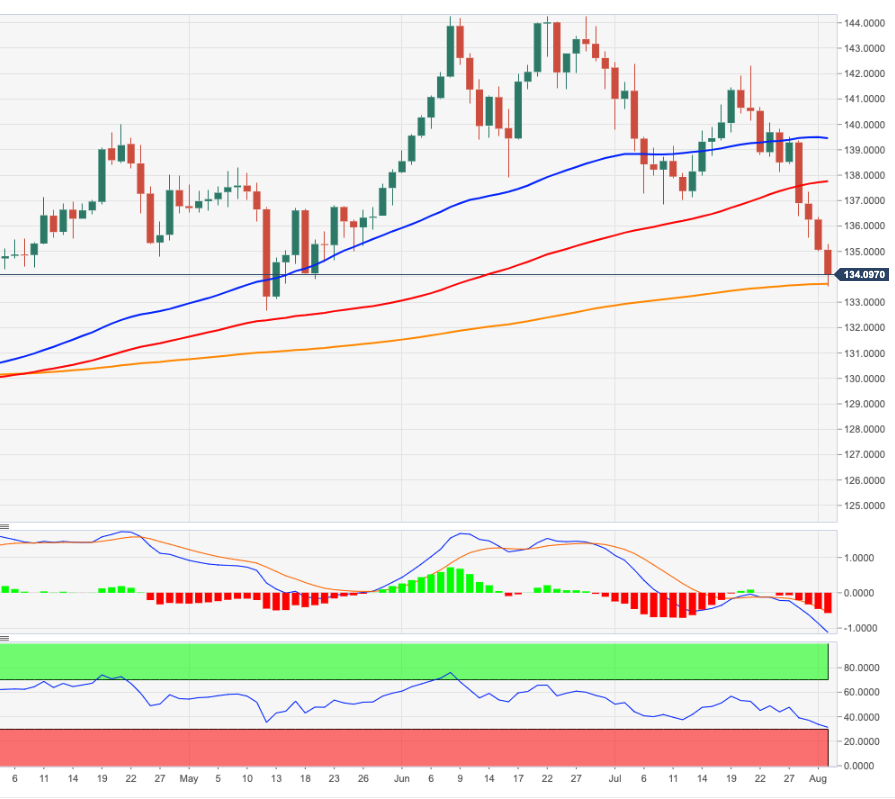
Source: Fx Street
With 6 years of experience, I bring to the table captivating and informative writing in the world news category. My expertise covers a range of industries, including tourism, technology, forex and stocks. From brief social media posts to in-depth articles, I am dedicated to creating compelling content for various platforms.


