
- EUR/JPY corrects sharply lower and challenges 134.00.
- A further drop could lead to a test at the 55-day mean.
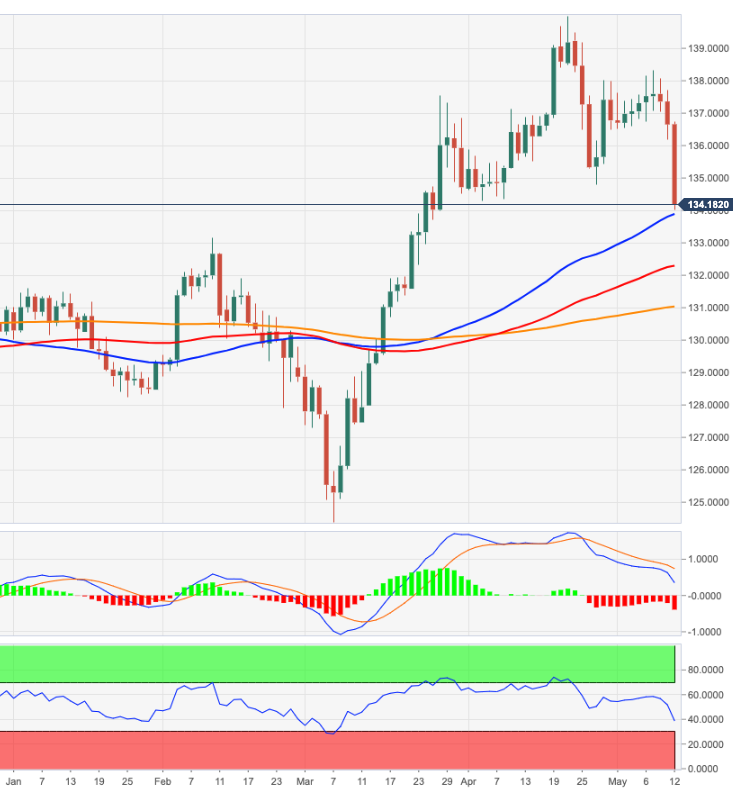
EUR/JPY extends the weekly move lower and revisits the 134.00 region thanks to the resurgence of risk aversion in the financial markets.
The continuation of the downtrend should find temporary support at the 55-day and 100-day SMAs at 133.87 and 132.27, respectively, on the short-term horizon. To the downside, then the ever-relevant 200-day simple moving average emerges today at 131.00.
Meanwhile, if it remains above the 200 SMA, the outlook for the cross is expected to remain constructive.
EUR/JPY day chart
Source: Fx Street
With 6 years of experience, I bring to the table captivating and informative writing in the world news category. My expertise covers a range of industries, including tourism, technology, forex and stocks. From brief social media posts to in-depth articles, I am dedicated to creating compelling content for various platforms.


