
- EUR/JPY is under pressure after fresh 2023 highs.
- The next upside barrier remains at the key round level of 160.00.
He USD/JPY reverses a five-day positive streak and breaks below the 159.00 support on Thursday.
Continuation of the uptrend could see the cross challenge the recent 2023 high near 159.76 (August 30) ahead of the key round level at 160.00. Breaking of the latter should not lead to any noteworthy resistance levels until the 2008 high at 169.96 (July 23).
For now, the long-term positive outlook for the cross looks favored as long as it remains above the 200-day SMA, today at 147.92.
EUR/JPY daily chart
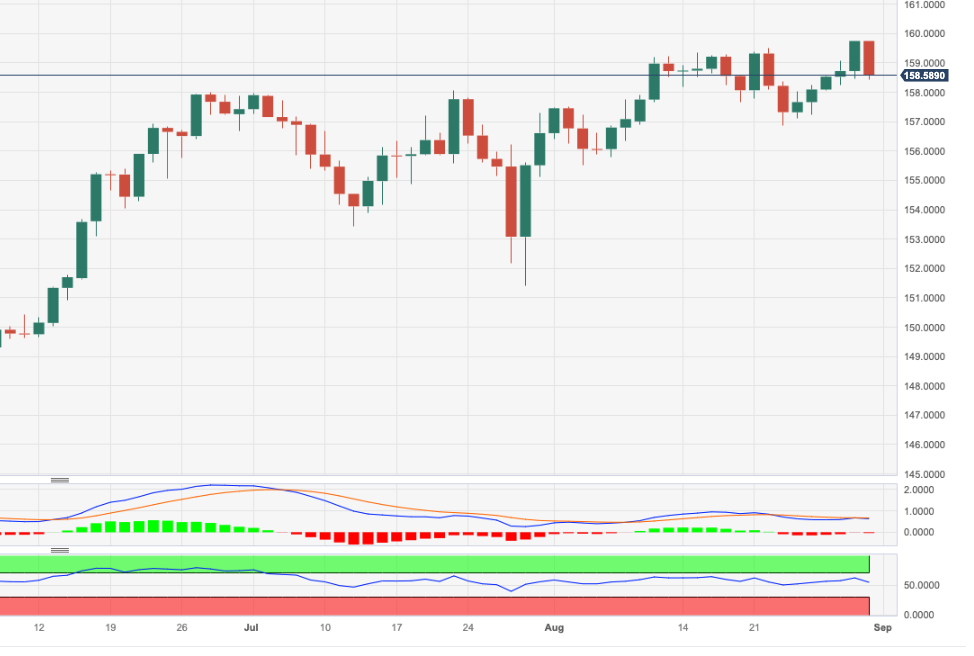
Source: Fx Street
I am Joshua Winder, a senior-level journalist and editor at World Stock Market. I specialize in covering news related to the stock market and economic trends. With more than 8 years of experience in this field, I have become an expert in financial reporting.


