
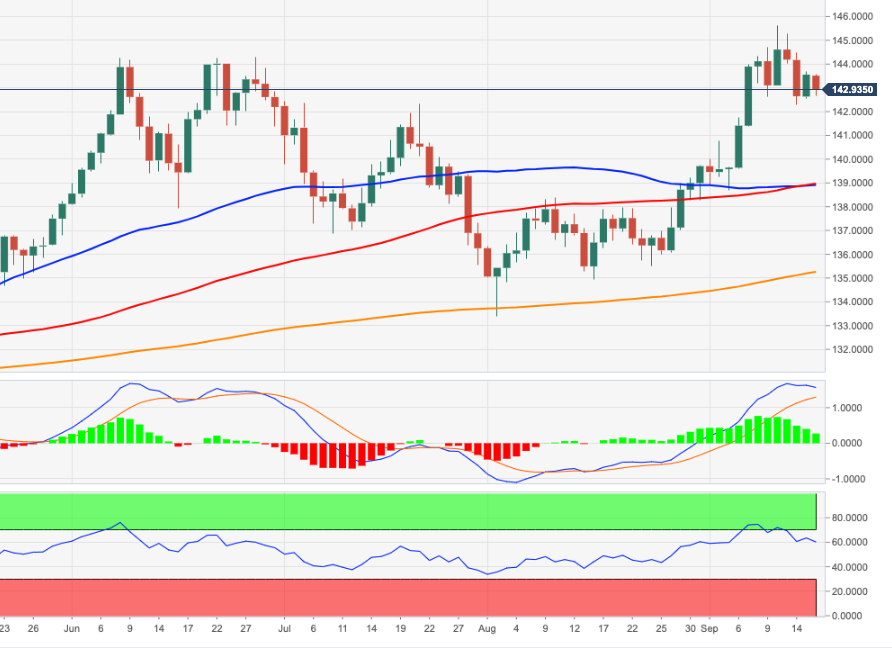
- EUR/JPY gives back Thursday’s gain and maintains known range.
- The cross appears to have entered a short-term consolidation phase.
EUR/JPY is trading within the known range, leaving behind Thursday’s rise to the 143.70 area.
The cross maintains the erratic behavior so far this week and extends the downward correction considering the bearish divergence in the daily RSI observed in recent sessions. That said, while a further decline is not to be ruled out, the cross could attempt some consolidation ahead of the likely continuation of the uptrend.
In the meantime, if it remains above the 200 SMA at 135.23, the outlook for the cross should remain constructive.
EUR/JPY day chart
Source: Fx Street
With 6 years of experience, I bring to the table captivating and informative writing in the world news category. My expertise covers a range of industries, including tourism, technology, forex and stocks. From brief social media posts to in-depth articles, I am dedicated to creating compelling content for various platforms.


