
- The daily RSI remains in negative territory, with the daily MACD showing flat red bars reflecting stable bearish momentum.
- The pair finds steady support near 168.00, stabilizing at 168.80 beyond the session low at 168.15.
- The prevailing bullish trend is maintained by the strength of the 100-day and 200-day SMAs.
On Monday, the pair EUR/JPY saw an initial drop to 168.15 before stabilizing at 168.80, which appears to affirm the strengthening of the support level around 168.00. Although effort is needed to reclaim the 20-day SMA in the near term to prevent further decline, the 168.00 barrier will likely act as a support for the bulls if market pressure intensifies.
The RSI on the daily chart now reads 47, maintaining its position in the negative area, implying a slightly bearish market disposition. The daily MACD maintains flat red bars, marking stable bearish momentum. This could perhaps signal a consolidation phase before any substantial changes.
EUR/JPY Daily Chart
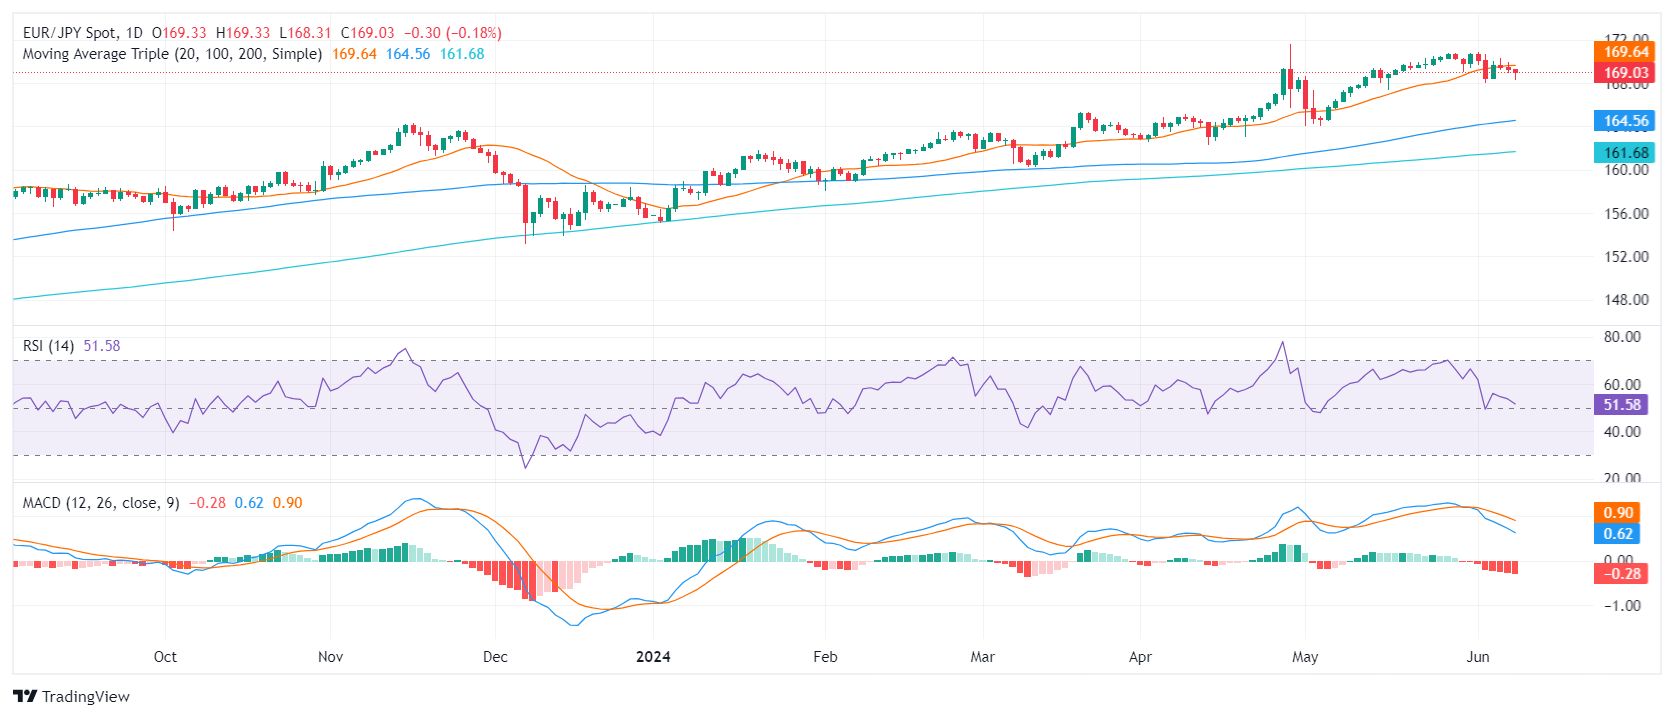
On the other hand, the broader bullish trend in EUR/JPY persists. The robust support provided by the 100-day and 200-day SMAs, located around 1640.00 and 161.00 respectively, remains a strong fortification against extensive bearish moves. Therefore, despite the slight bearish overtones in recent sessions, these fluctuations are possibly corrective rather than indicative of any significant alteration in the prevailing trend.
Source: Fx Street
I am Joshua Winder, a senior-level journalist and editor at World Stock Market. I specialize in covering news related to the stock market and economic trends. With more than 8 years of experience in this field, I have become an expert in financial reporting.


